MATH 3C Chapter Notes - Chapter 7: Quartile, Laplace Distribution, Normal Distribution

Document Summary
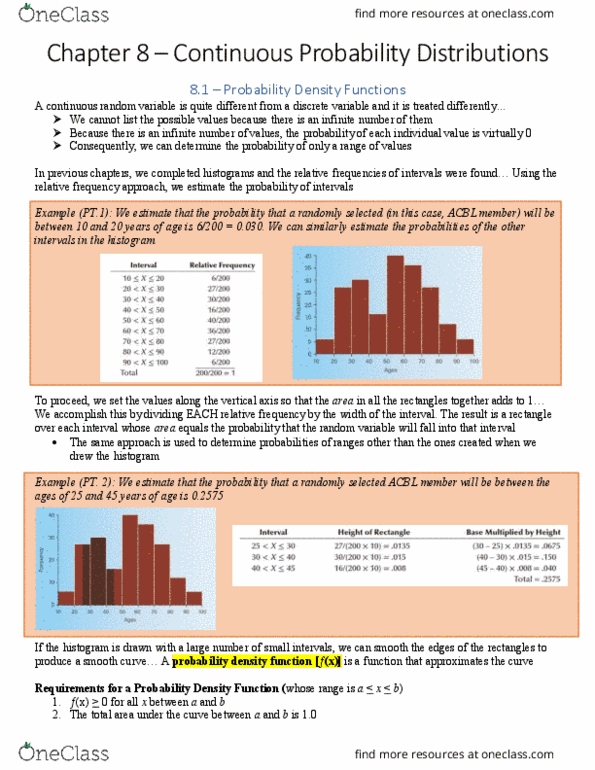
A graphical representation of a data set shown as adjacent rectangles, erected over nonoverlapping intervals (bins), with the area of each rectangle equal to the fraction of data points in the interval. Area of rectangle = fraction of data points. Use calculated area and known interval to find height of rectangle area. Usually written as x , a variable whose possible values are outcomes of a random phenomenon. Ex: rolling a die, winning lottery numbers, height of a random individual. Countable number of values (x 1 ,x 2, x 3 ,,) with probabilities (p 1 ,p 2 ,p 3 ,,) F(x) 0 for all x, probabilities are nonnegative. Fraction of data in a,[ b] = f(x) dx b a. F (x) x f (t)dt over interval ( x. = 0 (x)f is right continuous for all; lim y x+ , with rate parameter c > 0 f (x) The value of such that x (x)f.