STA 309 Chapter Notes - Chapter 4: Scatter Plot

Document Summary
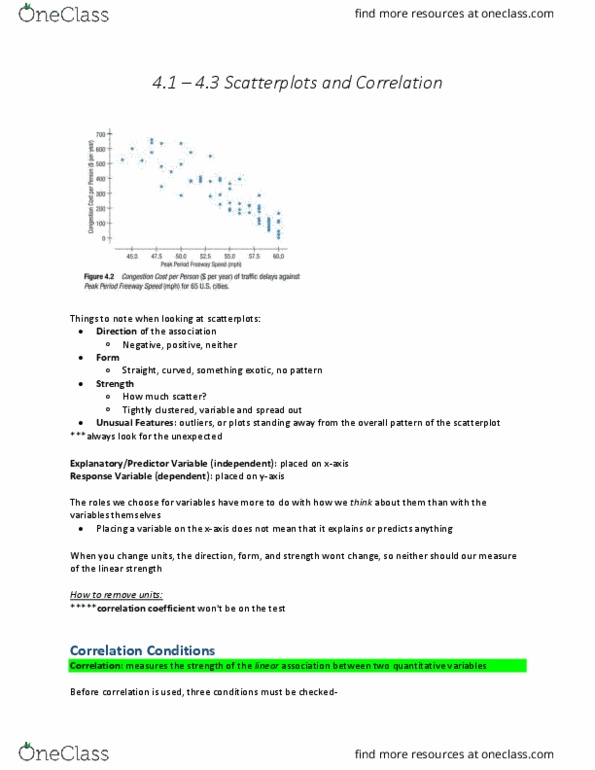
One quantitative variable measured against another quantitative variable. One must always ask if there is an association between two such variables. If so, outliers deserve special attention because it could mean something. 4. 2 assigning roles to variables in scatterplots: explanatory and predictor variables are basically independent and dependent variables with a twist. Correlation coefficient: multiply 1st and 2nd standardized value, sum up those cross products, and divide that total by number of pairs (n) minus 1. Ii: this formula is convenient using calculation done by hand. Quantitative variables condition both variables are quanititative. Linearity condition the scatterplot is straight enough. Outlier condition there are no obvious outliers. 4. 4 lurking variables and causation: fact: no matter how strong correlation is between two variables, there isn"t simple way to show from observational data that one variable causes the other. This is the lurking variable effect: always possibility that a 3rd party variable is.