L33 Psych 300 Chapter Notes - Chapter 2: Frequency Distribution, Statistical Hypothesis Testing, Unimodality

31 Jan 2019
School
Department
Course
Professor
Document Summary
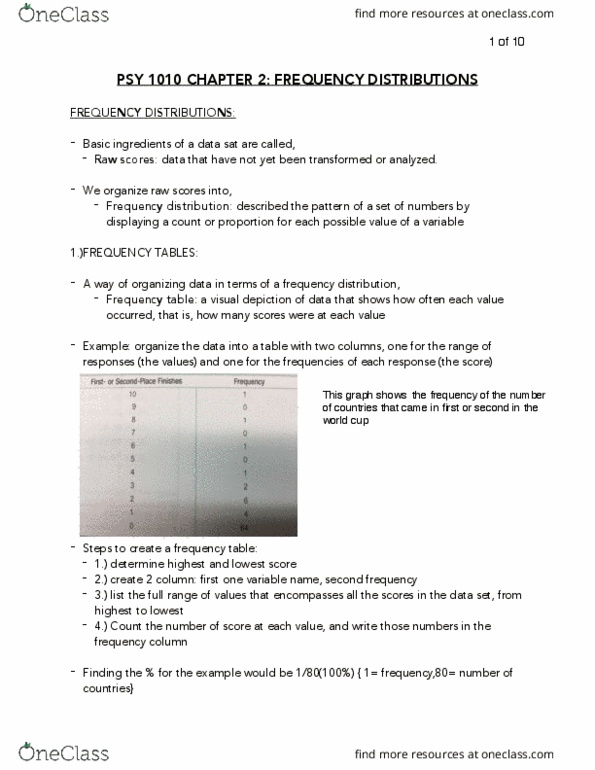
Frequency distributions proportion for each possible value of a variable (ex: a pattern of scores) Raw scores - data that has not yet been transformed or analyzed. Frequency distribution - pattern of a set of numbers by displaying a count or. Frequency table - comprised of two columns, one with all possible values and one. Definition: a visual depiction of data that shows how often each value occurred; with a count of how often each value occurs that is, how many scores at each value, indicating how many participants had each score. Left column: the possible values of the data (the score options) Include the full range of scores, even if 0 people said that number. Percentage: percent of times that value occurred out of our whole sample. Frequency: number (count) of times that value occurred in our sample. Once organized, the data can be displayed as a grouped frequency table, a histogram, or a frequency polygon.