GEOG 1HA3 Lecture Notes - Lecture 10: Marshall Islands, Telling Lies, Spatial Analysis

11 Apr 2018
School
Department
Course
Professor
Document Summary
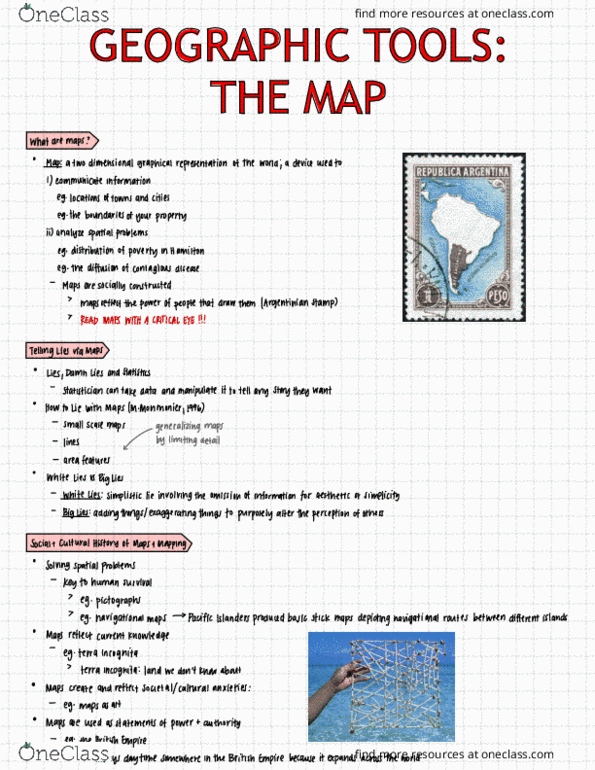
Map: a two-dimensional graphical representation of the world; a device used to 1) communicate information and 2) analyze spatial problems. Maps reflect the power of the people that draw them. Statistician can manipulate statistics and data so it will say anything. How to lie with maps (m. monmonier, 1996) Small scale maps (omitting small important information, ie. toronto) Area features (may omit cities it simplifies the map) Need to recognize that there may be omissions of the map and distortions. Social and cultural history of maps and mapping. Maps create and reflect societal/ cultural anxieties: map as art. Maps are used as statements of po(cid:449)er a(cid:374)d authorit(cid:455): e(cid:454). The british e(cid:373)pire (cid:862)the su(cid:374) (cid:374)e(cid:448)er sets o(cid:374) the e(cid:373)pire(cid:863) Maps are like other forms of visual representation of data (ex. figures, tables, etc. ) Key considerations in the production and understanding (interpreting), of maps: scale (cid:894)(cid:449)hat le(cid:448)el of represe(cid:374)tatio(cid:374) of the earth(cid:859)s surfa(cid:272)e is (cid:271)ei(cid:374)g (cid:272)o(cid:448)ered (cid:271)(cid:455) the map)