SOAN 2120 Lecture Notes - Lecture 3: Participant Observation, Subculture, List Of Statistical Packages

26 Feb 2016
School
Department
Course
Professor
Document Summary
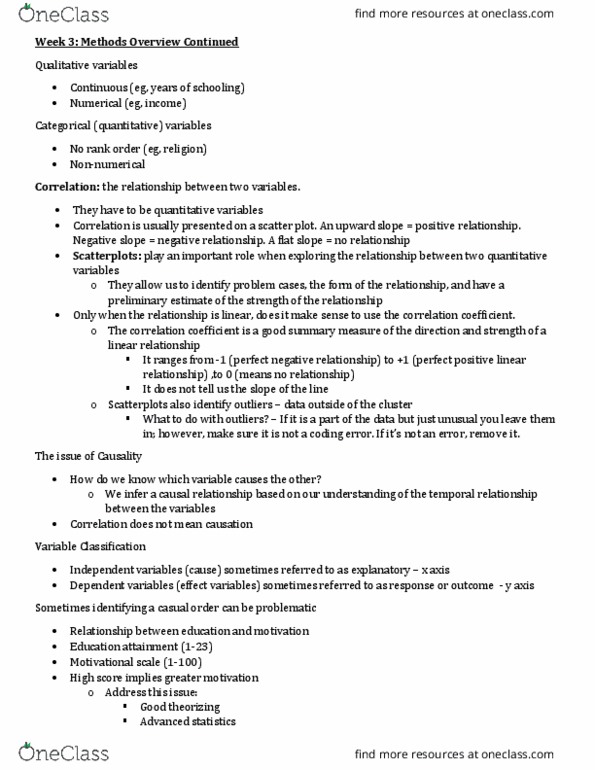
The posiive slope implies a posiive correlaion (upwards) Negaive slope = negaive relaionship (down wards) No relaionship between educaion and income (lat slope) Scaterplots play and important role exploring the relaionship between two quanitaive variables. They allow us to idenify problem, cases, the form of the relaionship (whether it is linear or not) and have a preliminary esimate of the strength og the relaionship. Only when the relaionship is linear does it make sense to use the correlaion coeicient. The correlaion coeicient is a good summary measure of the direcion and strength of a linear relaionship. It ranges from -1) perfect negaive linear relaionship) to +1 (perfect posiive linear relaionship); 0 means no linear relaionship. It does not tell us the slope of the line. Or you will never see a correlaion higher than 0. 7. We infer causal relaionship based on our understanding of temporal relaionship betweent the variables. Which variables occurs before the other in ime.