STAB22H3 Lecture 8: Normal Distribution

31 Jan 2019
School
Department
Course
Professor

STAB22H3 verified notes
8/18View all

Document Summary
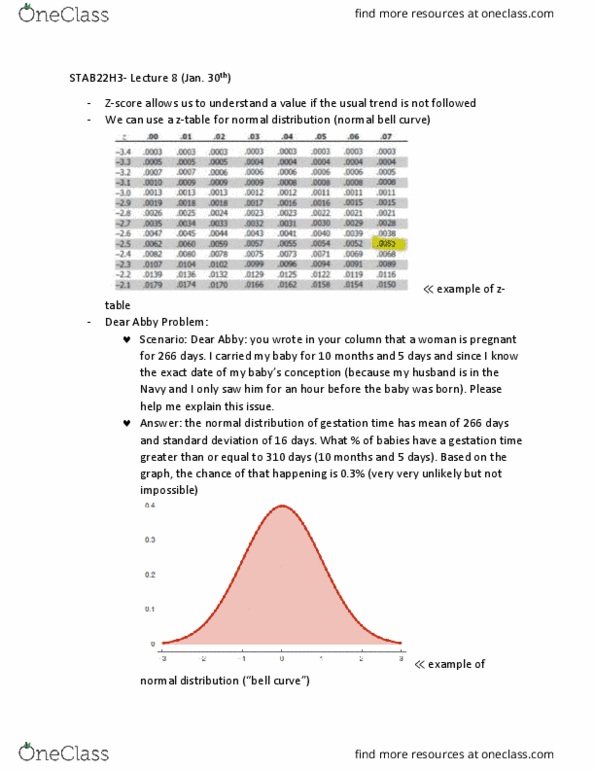
Z-score allows us to understand a value if the usual trend is not followed. We can use a z-table for normal distribution (normal bell curve) table. Scenario: dear abby: you wrote in your column that a woman is pregnant for 266 days. I carried my baby for 10 months and 5 days and since i know the exact date of my baby"s conception (because my husband is in the. Navy and i only saw him for an hour before the baby was born). Answer: the normal distribution of gestation time has mean of 266 days and standard deviation of 16 days. What % of babies have a gestation time greater than or equal to 310 days (10 months and 5 days). Based on the graph, the chance of that happening is 0. 3% (very very unlikely but not impossible) normal distribution ( bell curve )