Biology 2244A/B Lecture Notes - Lecture 7: Central Limit Theorem, Bias Of An Estimator, Normal Distribution

23 Apr 2016
School
Department
Course
Professor
Document Summary
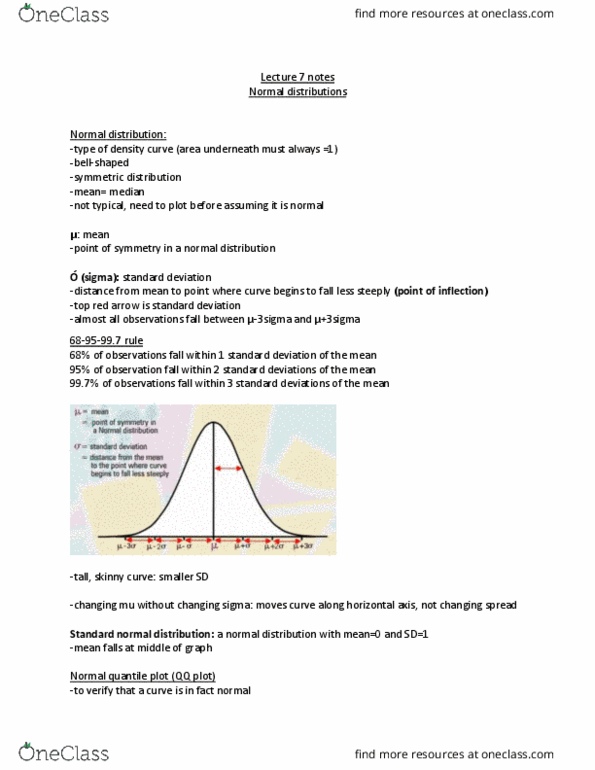
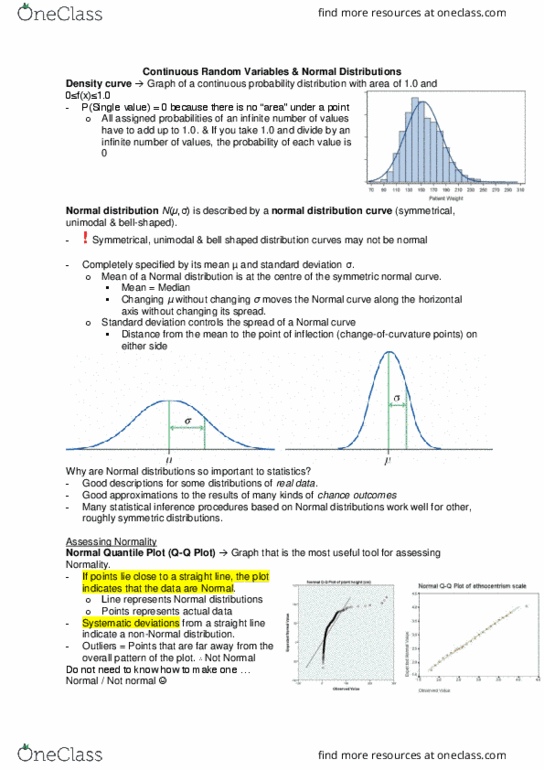
Symmetric, bell-shaped, one peak, and mean = median because distribution is symmetric. Standard deviation (sigma) is the distance from the mean to the point of inflection. With each unit of standard deviation, you add or subtract x sigma from miu. Another way to find standard deviation is to find the range of the data set and divide it by 6 since there are usually 3 standard deviations from each side of the mean. Density curves are used to describe continuous probability distributions a normal curve is a type of density curve. Normal distributions are described by their mean ( ) and their standard deviations ( ). The standard deviation controls the spread of the normal curve while the changing of the mean will move the curve along the horizontal axis. A normal distribution is described by a normal density curve. Any particular normal distribution is completely specified by two numbers: its mean and standard deviation.