STAT 1000Q Lecture Notes - Lecture 3: Decimal Mark, Data Set, Interquartile Range


73
STAT 1000Q Full Course Notes
Verified Note
73 documents
Document Summary
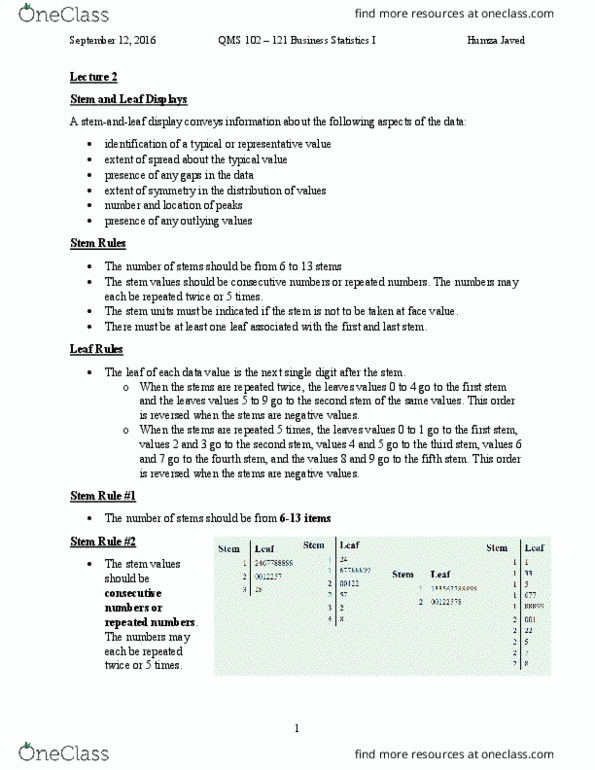
Data set: 10, 11, 11, 12, 12, 13. Steam-and-leaf display (each stem repeated twice) (0,4) (5,9) Stem-and-leaf display (each stem repeated 5 times) (0,1) (2,3) (4,5) (6,7) (8,9) Data set: 10. 0, 11. 0, 11. 0, 11. 0, 12. 0, 12. 0, 13. 0. The first digit after the decimal point leaves. Numerical descriptive measures of central tendency and variability. Central point: sample mean (arithmetic average, median. Sample mean (x) x1 + x2 + x3 + xn x= -------------------------, where x1 x2 -data points. Example 1 data set: 2, -3, 0, 0, 1 n = 5. The median is the value that falls in the middle, splits a data set into halves. Example 1 data sorted: -3, 0, 0, 1, 2 n = 5. If sample size (n) is odd, position for median is given by (n+1) / 2. N = 5 (0dd) position for median is 5 + 1. ------- = 3 (data point) media = 0.