STATS 250 Lecture Notes - Lecture 4: Standard Deviation, Standard Score

STATS 250 verified notes
4/7View all
Document Summary
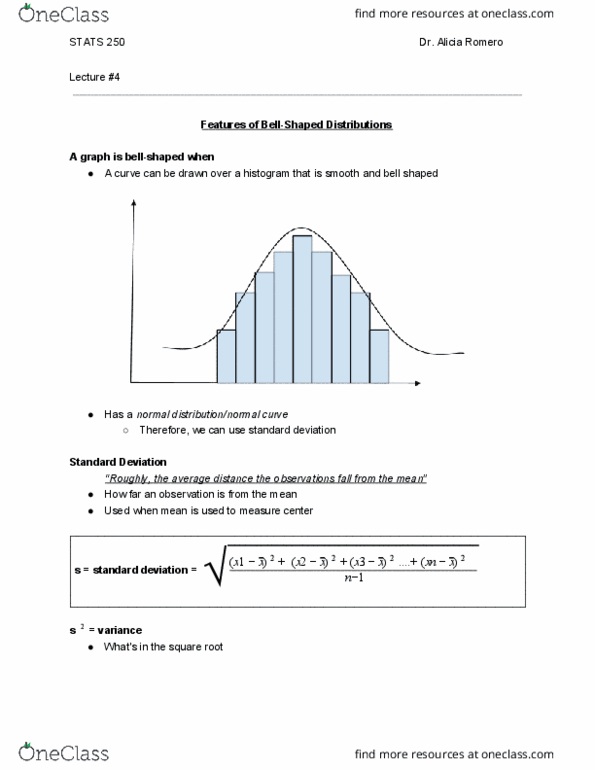
A curve can be drawn over a histogram that is smooth and bell shaped. Roughly, the average distance the observations fall from the mean . How far an observation is from the mean. Used when mean is used to measure center. 2 (x1 x) + (x2 x) + (x3 x) + (xn x) n 1. Weight measurements for 8 orders of chicken nuggets (in grams) On average, the weight of chicken nuggets vary by about 4. 31g from the mean weight of 76. 6g. S = 0 means there"s no spread. Every observation is the mean (the same) Like the mean, s is sensitive to extreme observations . Use the mean and standard deviation for symmetric distributions. The five-number summary is better for skewed distributions. A numerical summary based on a sample is a statistic. A numerical summary based on a population is a parameter. 68% of the values within 1 standard deviation of the mean in either deviation.