[STAT 2040] - Midterm Exam Guide - Ultimate 14 pages long Study Guide!

7 Feb 2017
School
Department
Course
Professor
Document Summary
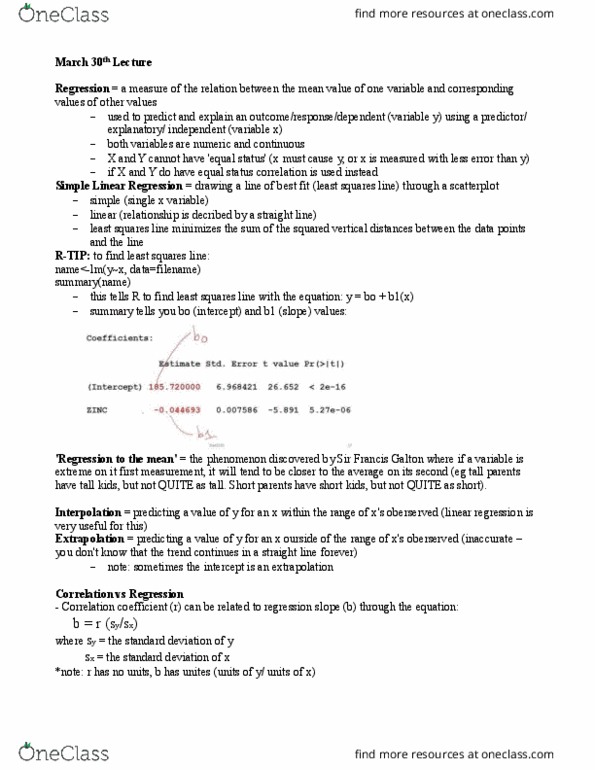
Regression = a measure of the relation between the mean value of one variable and corresponding values of other values. Used to predict and explain an outcome/response/dependent (variable y) using a predictor/ explanatory/ independent (variable x) X and y cannot have "equal status" (x must cause y, or x is measured with less error than y) if x and y do have equal status correlation is used instead. Simple linear regression = drawing a line of best fit (least squares line) through a scatterplot. Simple (single x variable) linear (relationship is decribed by a straight line) least squares line minimizes the sum of the squared vertical distances between the data points and the line. R-tip: to find least squares line: name