MATH 109 Lecture Notes - Lecture 6: Central Limit Theorem, Standard Deviation, Normal Distribution


6.2
●The Normal model is the most widely used probability model for continuous numerical
variables.
●The Central Limit Theorem links the Normal model to several key statistical ideas.
Visualizing the Normal Distribution
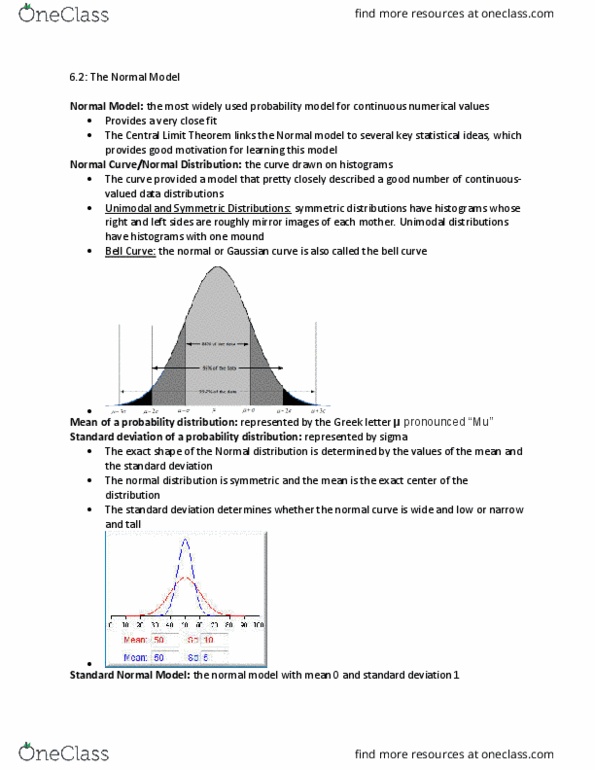
●Normal Curve/Normal Distribution: the curve drawn on the histogram.
○Sometimes called the Gaussian distribution
- The mean of a probability distribution sits at the balancing point of the probability distribution.
- The standard deviation of a probability distribution measures the spread of the distribution by
telling us how far away, typically, the values are from the mean.
●Mean of a Probability Distribution: represented by the Greek letter (mu, pronouncedμ
“mew”)
●Standard deviation of a Probability Distribution: represented by the character (sigma).σ
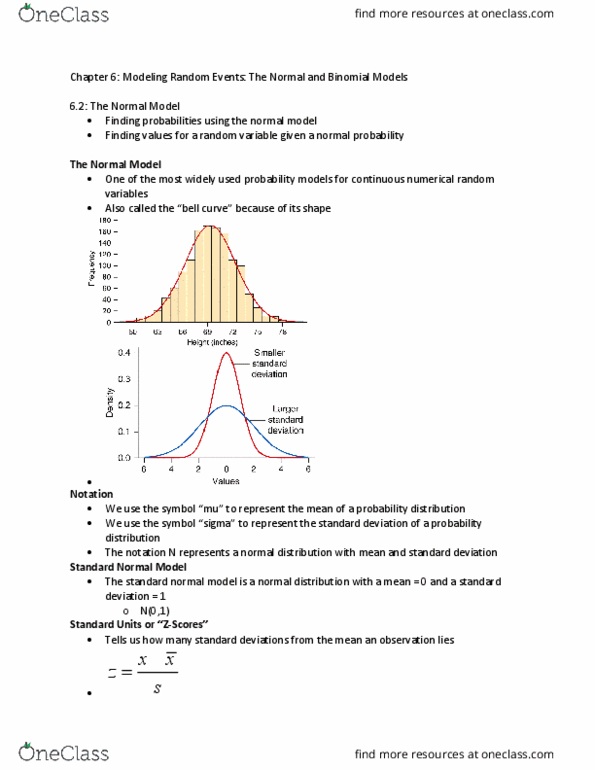
KEYPOINT: Because the Normal distribution is symmetric, the mean is in the exact center of the
distribution. The standard deviation determines whether the Normal curve is wide and low (large
standard deviation) or narrow and tall (small standard deviation).

- The only way to distinguish among different Normal distribution is by their means and standard
deviations. We can take advantage of this fact to write a short-hand notation to represent a
particular Normal distribution.
★The notation N( , ) represents a Normal distribution that is centered at the valueμ σ
of (the mean of the distribution) and whose spread is measured by the values of μ σ
(the standard deviation of the distribution).
KEYPOINT: The Normal distribution is symmetric and unimodal (“bell-shaped”). The notation ( , μ σ
) tells us the mean and standard deviation of the Normal distribution.
Finding Normal Probabilities
KEYPOINT: When you are finding probabilities with Normal models, the first and most helpful step is
to sketch the curve, label it appropriately, and shape in the region of interest.
Without Technology: The Standard Normal
●Because the mean is 0 standard deviations away from itself, and any point 1 standard deviation
away from the mean is 1 standard unit. (To convert the mean and standard deviation to
standard units).
●Standard Normal model: the Normal model with mean 0 and standard deviation 1.
KEYPOINT: N(0,1) is the standard Normal model: a Normal model with a mean of 0 ( = 0) and aμ
standard deviation of 1 ( = 1).σ
★IMPORTANT: z
= (Formula to find z-Scores for Normal probabilities)
σ
x − μ
Example: Find the probabilities that a randomly selected women is shorter than 62 inches. This person is
selected from a population of women whose heights follow a N(64,3) distribution.
1. Convert 62 inches to standard units. Call this number z
2. Look up the area below z
in the table for the N(0,1) distribution.
Example 5: Small Pups
Suppose the length of a newborn seal pup follows a Normal distribution with a mean length of 29.5
inches and a standard deviation of 1.2 inches.
Document Summary
The normal model is the most widely used probability model for continuous numerical. The central limit theorem links the normal model to several key statistical ideas. Normal curve/normal distribution : the curve drawn on the histogram. The mean of a probability distribution sits at the balancing point of the probability distribution. The standard deviation of a probability distribution measures the spread of the distribution by telling us how far away, typically, the values are from the mean. Mean of a probability distribution : represented by the greek letter (mu, pronounced. Standard deviation of a probability distribution : represented by the character. Keypoint : because the normal distribution is symmetric, the mean is in the exact center of the distribution. The standard deviation determines whether the normal curve is wide and low (large standard deviation) or narrow and tall (small standard deviation). (sigma). The only way to distinguish among different normal distribution is by their means and standard deviations.