MATH 10041 Chapter Notes - Chapter 6: Central Limit Theorem, Gaussian Function, Standard Deviation

8 Mar 2019
School
Department
Course
Professor

6.2: The Normal Model
Normal Model: the most widely used probability model for continuous numerical values
• Provides a very close fit
• The Central Limit Theorem links the Normal model to several key statistical ideas, which
provides good motivation for learning this model
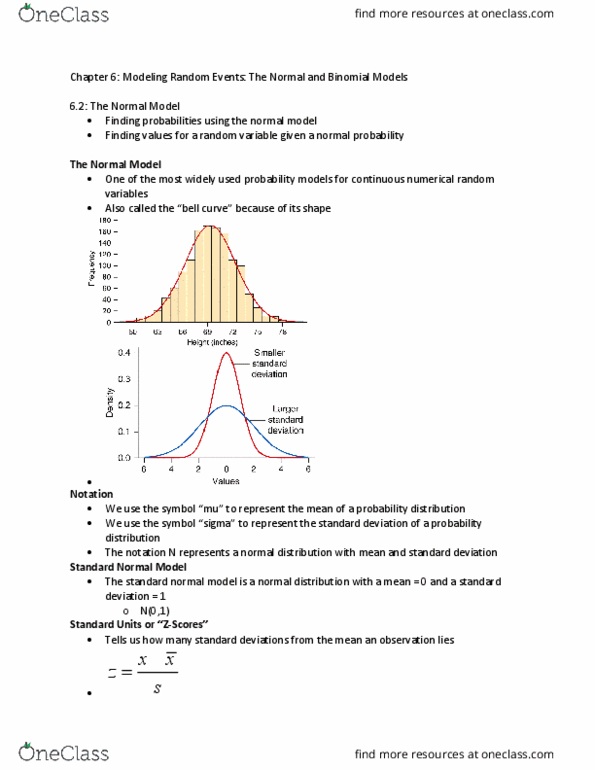
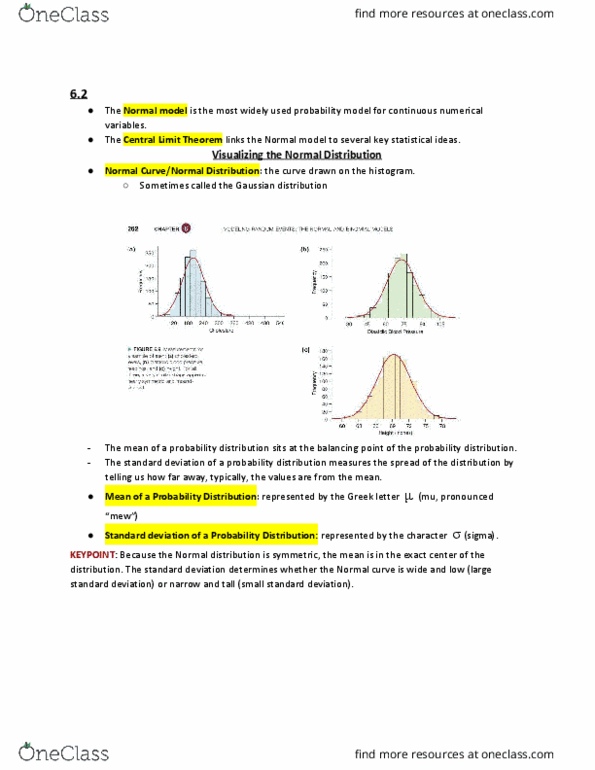
Normal Curve/Normal Distribution: the curve drawn on histograms
• The curve provided a model that pretty closely described a good number of continuous-
valued data distributions
• Unimodal and Symmetric Distributions: symmetric distributions have histograms whose
right and left sides are roughly mirror images of each mother. Unimodal distributions
have histograms with one mound
• Bell Curve: the normal or Gaussian curve is also called the bell curve
•
Mean of a probability distribution: represented by the Greek letter μ pronounced “Mu”
Standard deviation of a probability distribution: represented by sigma
• The exact shape of the Normal distribution is determined by the values of the mean and
the standard deviation
• The normal distribution is symmetric and the mean is the exact center of the
distribution
• The standard deviation determines whether the normal curve is wide and low or narrow
and tall
•
Standard Normal Model: the normal model with mean 0 and standard deviation 1