ECON1102 Lecture Notes - Lecture 4: Compound Annual Growth Rate, Real Interest Rate, Compound Interest


4. ECONOMIC GROWTH
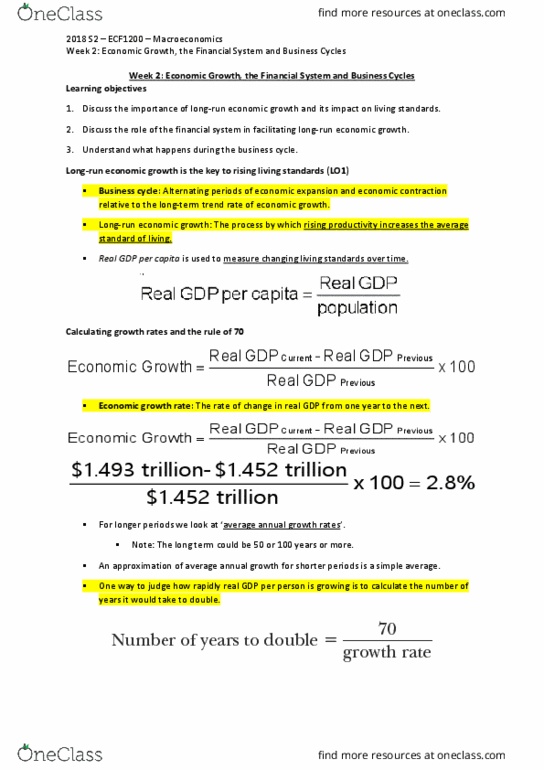
HOW DO WE CALCULATE GROWTH?
- We can use the simple arithmetic of proportionate change, .e. the change in a value between two
period divided by the value of the variable in the initial period for two periods close together
- This can be general y expressed as per below, the change in y between period t and t +1:
EXAMPLE OF GDP GROWTH CALCULATION
- Lets apply this formula to Australian GDP as an example
- Given Australian real GDP of $1.452 trillion in 2012 and $1.493 trillion in 2013 (for fiscal years ending in
June 30), the growth rate in real GDP between fiscal 2012 and 2013 was:
o 1.493-1.452/1.452 = 0.038 x 100 = 2.8%
FINANCIAL COMPOUNDING
- Financial opoudig refers to a proess here the alue of a iestet ireases
epoetiall oer tie due to opoud iterest
- Copoud iterest is iterest hih is alulated ot ol o the iitial priiples ut also the
auulated iterest of prior periods.
- In other words, interest is paid on both principal and the interest being earned on that principal as it is
accumulating
- This process means that relatively low annual growth rates (more generally periodic growth rates) can
lead to big changes over time
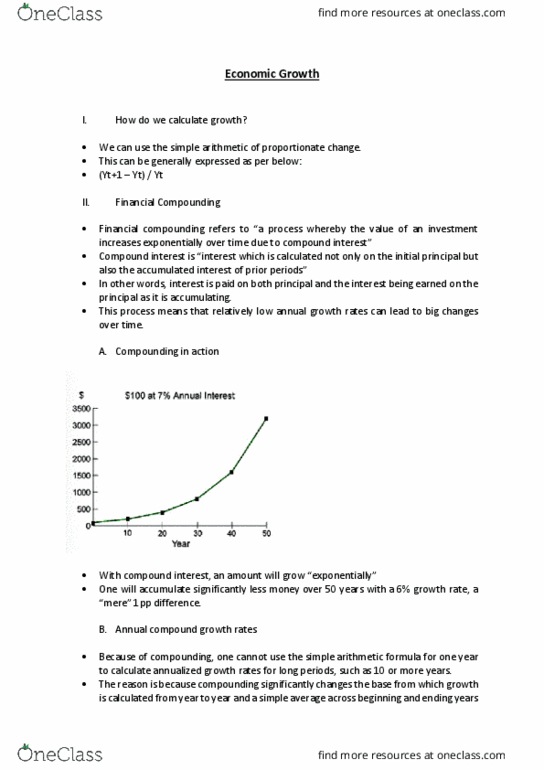
COMPOUNDING IN ACTION
- One can see that, with compound interest, an amout ill gro epoetiall.
- Note that oe ill auulate sigifiatl less oe oer 0 ears ith a % groth rate, a ere
1 pp (percentage point) difference.
find more resources at oneclass.com
find more resources at oneclass.com

ANNUAL COMPOUND GROWTH RATES
- Because of compounding, one cannot use the simple arithmetic formula we used earlier for one year to
calculate annualized growth rates for long periods, such as 10 or more years
- The reason is because compounding significantly changes the base from which growth is calculated
from year to year and a simple average across beginning and ending years does not account for this
(though for a few years time period this difference will generally not be that important.)
- So we can use the Compound Annual Growth Rate (CAGR) formula to get a better annualized estimate.
CAGR FORMULA
- Formula for CAGR is presented below. Compound Annual Growth Rate (CAGR).
- Generally we will not need to be calculating this by hand, using a computer or calculator instead.
- Main point is to recognise that this rate provides a much accurate measure of annualized growth over
long periods.
- Contributes to wealthier countries getting ahead because their base year gets higher and higher every
year in comparison to poorer countries.
ECONOMIC P‘OBLEM OF GROWTH
- Modern economies are built on regular and constant economic growth, compounded
- Modern economic paradigm of the last 300 years or so is built to grow and people have come, overall,
to expect regular increases in economic output and income
- If there is no growth, stagnation occurs and this leads to what feels like a permanent recession – or
worse
- Power of economic growth: real GDP per capita (GDP adjusted for
inflation) in Australia increased by a factor of 5 over 100 years.
JAPAN“ LO“T ECONOMIC DECADES
- Japa has uderperfored ad falled behind Western Europe, and
it has badly lagged North America. And neither Western Europe or
North Aeria had a er good deade i the 2000s!
UNDERSTANDING AND EXPLAINING GROWTH
- Japanese GDP has basically remained stagnant for 20 years now while other coutnries have grown.
- Ee opared to those outries ith tepid groth this eas Japas eoo is shrikig relatie
to the rest of the world .
- It also means that Japanese living standards are stuck in absolute terms and falling in relative terms.
- Economic question: why?
find more resources at oneclass.com
find more resources at oneclass.com

- Policy question: what can be done about it?
- Well osider a odel of eooi groth ad easures of groth that a e used to uderstad
possible causes and potential cures – for Japan and other countries.
- Maddison time series of 2000 years is a highly respected piece of work and a very respectable effort
- Aust. time series presented earlier is based largely on govt. census data collected over the period.
- Which piece of work do you find more believeable?
- A proper answer to that question requires a careful look at the actual underlying data, but in general
one should approach very long time-series, like Maddisos, ith osiderale autio. Most of the
data, especially pre-1800, has had to be imputed or cobbled together from other sources and very
ancient data are often least reliable of all.
MODE‘N G‘OWTH ‘ATES
- Maddisos data do poit to a true patter: sustaied ireases i aterial output related to ut
distit for stadards of liig is a reet pheoeo, i.e. there as a take-off i per paita GDP,
as far as we can measure it, on a national level starting in 1700s.
- Moder eooi groth ol eerged i the ost reet to or three eturies. The Great
Diergee as eooists all this tred, refers to the era of ireased differee i aterial output
per capita across countries. Before 1700, nations differed in this regard by only a factor of two or three,
while today it is over a factor of 50 for several countries.
SO WHAT DRIVES ECONOMIC GROWTH?
- Long-term growth and short-term growth fluctuations have different models.
find more resources at oneclass.com
find more resources at oneclass.com
Document Summary
We can use the simple arithmetic of proportionate change, . e. the change in a value between two period divided by the value of the variable in the initial period for two periods close together. This can be general y expressed as per below, the change in y between period t and t +1: Lets apply this formula to australian gdp as an example. Given australian real gdp of . 452 trillion in 2012 and . 493 trillion in 2013 (for fiscal years ending in. June 30), the growth rate in real gdp between fiscal 2012 and 2013 was: 1. 493-1. 452/1. 452 = 0. 038 x 100 = 2. 8% Financial (cid:272)o(cid:373)pou(cid:374)di(cid:374)g refers to a (cid:862)pro(cid:272)ess (cid:449)here(cid:271)(cid:455) the (cid:448)alue of a(cid:374) i(cid:374)(cid:448)est(cid:373)e(cid:374)t i(cid:374)(cid:272)reases e(cid:454)po(cid:374)e(cid:374)tiall(cid:455) o(cid:448)er ti(cid:373)e due to (cid:272)o(cid:373)pou(cid:374)d i(cid:374)terest(cid:863) Co(cid:373)pou(cid:374)d i(cid:374)terest is (cid:862)i(cid:374)terest (cid:449)hi(cid:272)h is (cid:272)al(cid:272)ulated (cid:374)ot o(cid:374)l(cid:455) o(cid:374) the i(cid:374)itial pri(cid:374)(cid:272)iples (cid:271)ut also the a(cid:272)(cid:272)u(cid:373)ulated i(cid:374)terest of prior periods. (cid:863)