STAT150 Lecture Notes - Lecture 2: Standard Deviation, Quartile, Interquartile Range

28 Aug 2018
School
Department
Course
Professor
Document Summary
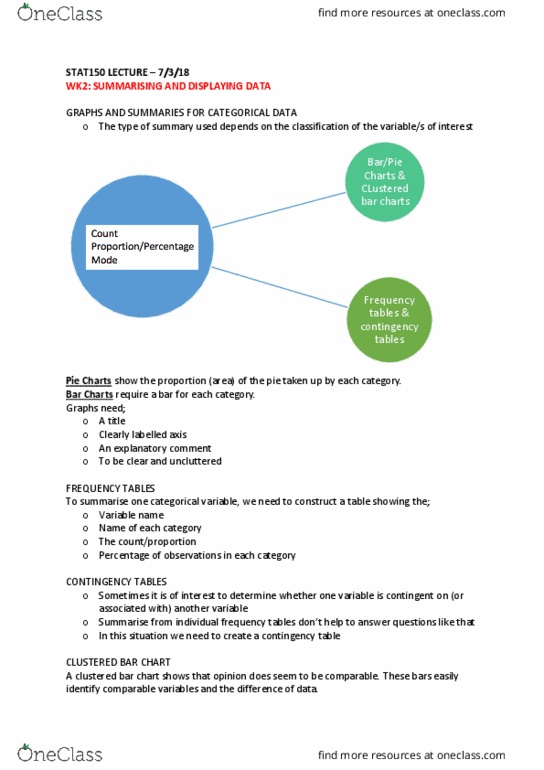
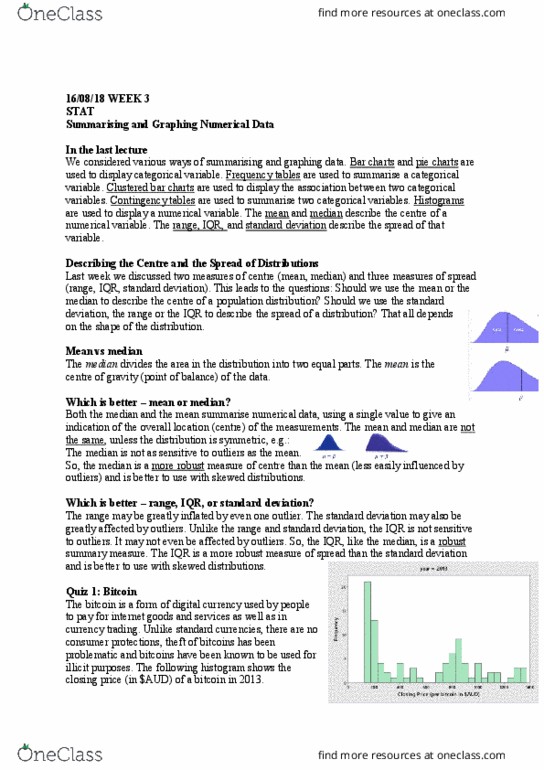
The type of summary used depends on the classification of the variable/s of interest. To summarise one categorical variable we need to. The table should also show the total sample size. Sometimes it is of interest to determine whether one variable is contingent on (or associated with) another variable. Summaries from individual frequency tables don"t help to answer questions like that. For numerical data, we can thing of distribution as the shape, centre, and spread of its histogram. To describe shape we focus on the presence of absence of symmetry, modes and gaps or outliers. The shape of a histogram can be described thought its modality, symmetry and any outliers, but it would also be useful to describe its centre and its spread. A measure of centre tells us where we can find the "middle" of the data- that is, roughly the middle of the histogram. A measure of spread tells us how spread out the histogram is.