ECON10005 Lecture Notes - Lecture 9: Type I And Type Ii Errors, Null Hypothesis
64 views2 pages

Get access
Grade+
$40 USD/m
Billed monthly

Homework Help
Study Guides
Textbook Solutions
Class Notes
Textbook Notes
Booster Class
10 Verified Answers
Class+
$30 USD/m
Billed monthly

Homework Help
Study Guides
Textbook Solutions
Class Notes
Textbook Notes
Booster Class
7 Verified Answers
Related Documents
Related Questions
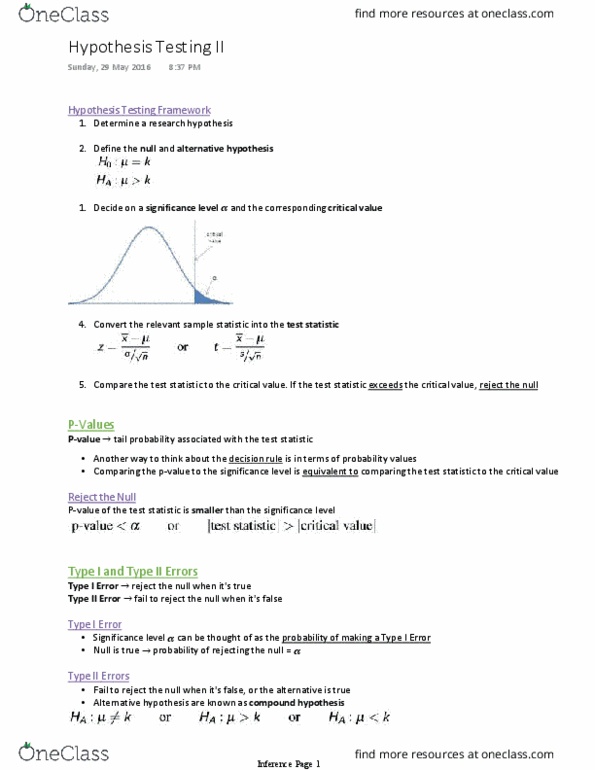
| 1 | Which of the following statements about Type I and Type II errors is correct | ||||||||
| a | Type I: Reject a true alternative hypothesis. Type II: Do not reject a false alternative. | ||||||||
| b | Type I: Reject a true null hypothesis. Type II: Do not reject a false null hypothesis. | ||||||||
| c | Type I: Reject a false null hypothesis. Type II: Reject a true null hypothesis. | ||||||||
| d | Type I: Do not reject a false null hypothesis. Type II: Reject a true null hypothesis. | ||||||||
| 2 | You are reading a report that contains a hypothesis test you are interested in. The writer of the report writes that the p-value for the test you are interested in is 0.0749, but does not tell you the value of the test statistic. From this information you can: | ||||||||
| a | Not reject the hypothesis at a Probability of Type I error = .05, but reject the hypothesis at a Probability of Type I error = 0.10 | ||||||||
| b | Reject the hypothesis at a Probability of Type I error = .05, and reject at a Probability of Type I error = 0.10 | ||||||||
| c | Not reject the hypothesis at a Probability of Type I error = 0.05, and not reject at a Probability of Type I error = 0.10 | ||||||||
| d | Reject the hypothesis at a Probability of Type I error = .05, but not reject at a Probability of Type I error = 0.10 | ||||||||
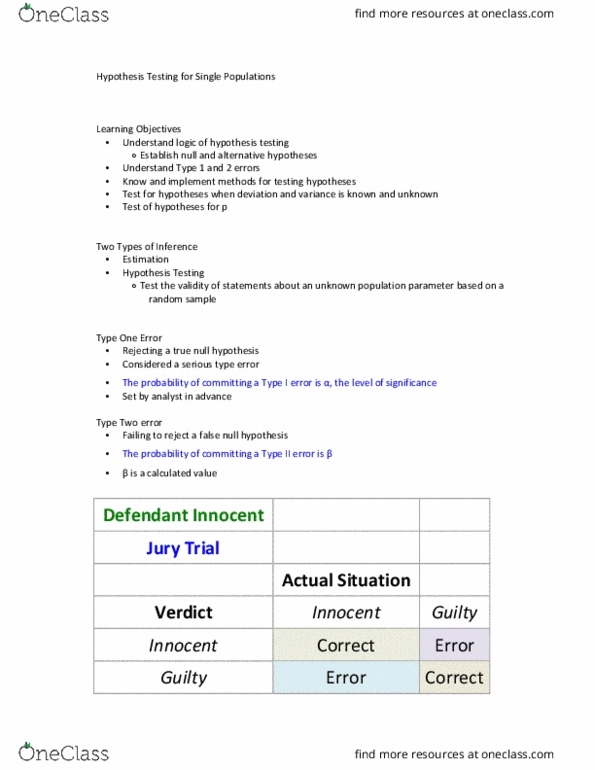
| 3 | The random sample below is obtained to test the following hypothesis about the population mean. | ||||||||
| H?: ? ? | 1500 | ||||||||
| H?: ? > | 1500 | ||||||||
| 620 | 1711 | 366 | 2528 | 2678 | 1661 | 442 | 725 | 1938 | |
| 409 | 330 | 2480 | 542 | 369 | 2124 | 549 | 2074 | 1665 | |
| 1873 | 873 | 2143 | 2061 | 1177 | 2509 | 1264 | 2397 | 1523 | |
| 1837 | 1958 | 1041 | 1639 | 2199 | 2232 | 387 | 2270 | 2136 | |
| 1111 | 1883 | 2612 | 2230 | 1597 | 1726 | 694 | 1990 | 1354 | |
| 2090 | 909 | 2128 | 1608 | 747 | 1121 | 2220 | 2390 | 2347 | |
| 1041 | 316 | 655 | 632 | 2064 | 1901 | 532 | 552 | 846 | |
| 2704 | 1410 | 2165 | 1065 | 937 | 1452 | 2539 | 410 | 656 | |
| 1169 | 527 | 809 | 2364 | 2350 | 2210 | 1459 | 2391 | 856 | |
| 2711 | 1985 | 2382 | 2289 | 1927 | 518 | 2177 | 437 | 1151 | |
| 2018 | 1580 | 607 | 2715 | 2188 | 1691 | 1394 | 2610 | 1186 | |
| 695 | 2428 | 2246 | 858 | 2036 | 1681 | 2449 | 1578 | 1971 | |
| 1846 | 1729 | 2389 | 1737 | 1913 | 1863 | 2072 | 2593 | 2287 | |
| 2220 | 2230 | 551 | 458 | 2626 | 2731 | 488 | 2551 | 1736 | |
| 1373 | 307 | 1803 | 2647 | 2679 | 1508 | 1468 | 1443 | 516 | |
| 1002 | 2116 | 2616 | 817 | 2522 | 460 | 1879 | 1999 | 1837 | |
| The level of significance of the test is ? = 0.05. Compute the relevant test statistic. | |||||||||
| This is a(n) _______ (two-tail, upper-tail, lower-tail) test. The test statistic is TS = _______. | |||||||||
| a | Two-tail test | TS = | 1.81 | ||||||
| Do not reject H?: ? ? 1500. Conclude that the population mean is not greater than 1500. | |||||||||
| b | Upper tail test. | TS = | 1.52 | ||||||
| Do not reject H?: ? ? 1500. Conclude that the population mean is not greater than 1500. | |||||||||
| c | Upper tail test. | TS = | 1.81 | ||||||
| Reject H?: ? ? 1500. Conclude that the population mean is greater than 1500. | |||||||||
| d | Lower tail test. | TS = | 1.98 | ||||||
| Do not reject H?: ? ? 1500. Conclude that the population mean is no greater than 1500. | |||||||||
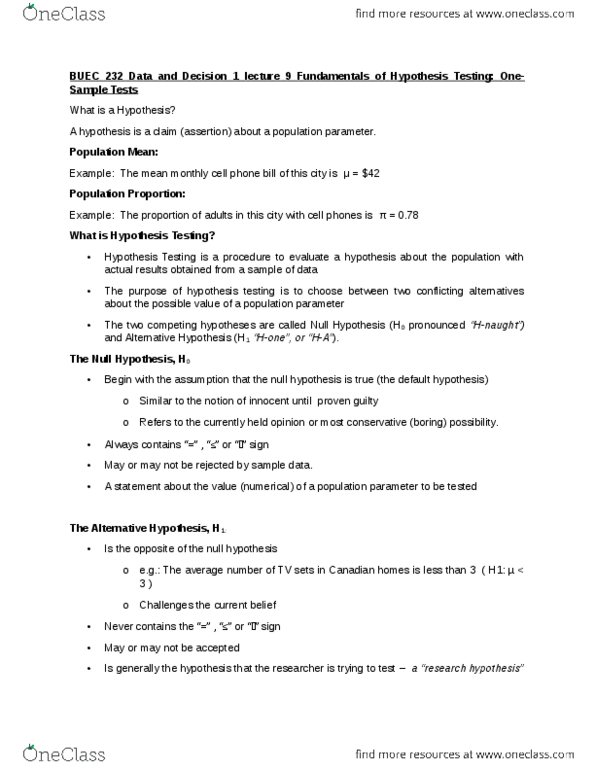
| 4 | Consider the following hypothesis test. | ||||||||
| H?: ? ? | 30 | ||||||||
| H?: ? > | 30 | ||||||||
| A random sample of n = 15 yielded the following observations | |||||||||
| 51 | 38 | 26 | 16 | 28 | |||||
| 57 | 20 | 33 | 35 | 23 | |||||
| 21 | 47 | 56 | 54 | 36 | |||||
| Use ? = | 0.05 | ||||||||
| TS = ______ | CV = ______ | State the decision rule. | |||||||
| a | 1.68 | 1.761 | Do not reject H?. Conclude the mean is not greater than 30. | ||||||
| b | 1.68 | 1.64 | Reject H?. Conclude the mean is greater than 30. | ||||||
| c | 1.847 | 2.145 | Do not reject H?. Conclude the mean is not less than 30. | ||||||
| d | 1.847 | 1.761 | Reject H?. Conclude the mean is less than 30. | ||||||
| 5 | In a recent study, a major fast food restaurant had a mean service time of 165 seconds. The company embarks on a quality improvement effort to reduce the service time and has developed improvements to the service process. The new process will be tested in a sample of stores. The new process will be adopted in all of its stores, if it reduced mean service time by more than 45 seconds compared to the current mean service time. To perform the hypothesis test, the sample of 48 stores yields the following data (seconds). | ||||||||
| 90 | 96 | 133 | 108 | 136 | 110 | 119 | 138 | ||
| 129 | 98 | 101 | 92 | 135 | 124 | 115 | 90 | ||
| 132 | 125 | 110 | 124 | 126 | 138 | 94 | 130 | ||
| 108 | 96 | 140 | 135 | 102 | 114 | 109 | 137 | ||
| 138 | 104 | 108 | 134 | 92 | 107 | 96 | 119 | ||
| 105 | 111 | 96 | 136 | 126 | 116 | 98 | 131 | ||
| Use ? = | 0.05 | ||||||||
| |TS| = ______ | |CV| = ______ | ||||||||
| a | 1.548 | 1.678 | Do not reject H?. The mean service time is not reduced by more than 45 seconds. Do not adopt the new process. | ||||||
| b | 1.871 | 1.678 | Reject H?. The mean service time is reduced by more than 45 seconds. Adopt the new process. | ||||||
| c | 1.871 | 1.640 | Do not reject H?. The mean service time is not reduced by more than 45 seconds. Do not adopt the new process. | ||||||
| d | 1.548 | 1.640 | Reject H?. The mean service time is reduced by more than 45 seconds. Adopt the new process. | ||||||