ACCT1101 Lecture Notes - Lecture 15: Asset, Inventory Turnover, Basionym

Document Summary
Get access


Related Documents
Related Questions
Ratio Analysis
The comparative statements offinancial position of IKEA Furniture Outlay Retail Shop in Sydneyfor the current year and previous year are given below. Calculatethe ratios necessary to evaluate the shopâs performance
IKEA Furniture Outlay Profit & Loss Statement
For the year ended30th June 2012 & 2013
2012 | 2013 | |
Sales( all credit) | 220 000 | 250 000 |
Less Cost of Sales: | 76 500 | 124 000 |
Opening Inventory | 65 000 | 85 000 |
Purchases | 99 500 | 144 000 |
Goods available for sale | 164 500 | 229 000 |
Closing Inventory | (88 000) 76 500 | (105 000) 124 000 |
Gross Profit | 143 500 | 126 000 |
Operating Expenses | 39 700 | 71 060 |
Net Profit | 103 800 | 54 940 |
IKEA Furniture OutlayBalance Sheet as at 30th June2012/2013
2012 | 2013 | |
Assets: | ||
Current Assets: | ||
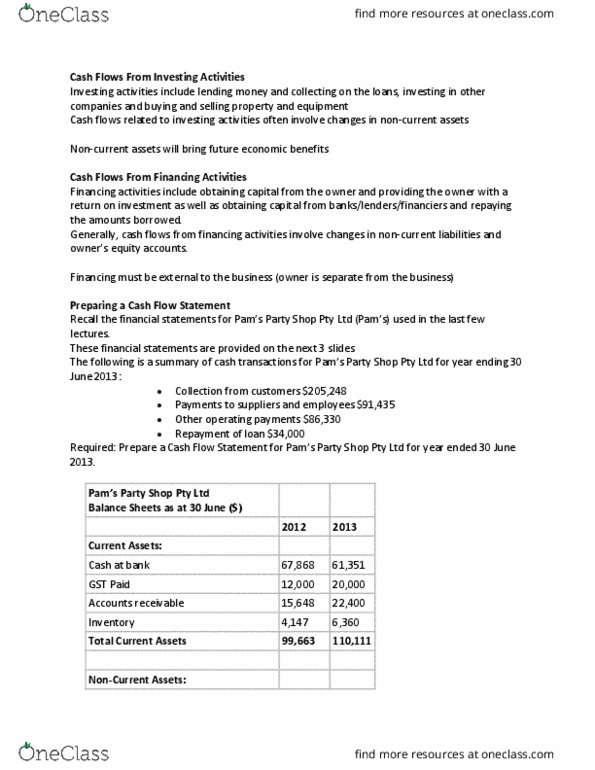
Cash | 75 700 | 87 000 |
Accounts Receivable | 69 000 | 68 500 |
Inventory | 88 000 | 105 000 |
Total CurrentAssets | 232 700 | 260 500 |
Non-CurrentAssets: | ||
Plant and Equipment | 295 000 | 208 500 |
Total Assets: | 527 700 | 469 000 |
Liabilities | ||
CurrentLiabilities | ||
Accounts Payable | 51 500 | 59 950 |
Bank overdraft | 15 200 | 20 500 |
Total CurrentLiabilities | 66 700 | 80 450 |
NoncurrentLiabilities: | ||
6.5% Bank Loan | 333 000 | 243 070 |
Total non-currentliabilities: | 333 000 | 243 070 |
Totalliabilities | 399 700 | 323 520 |
Ownerâs Equity | ||
Ordinary shares of $2 each | 95 000 | 100 100 |
Retained profit | 33 000 | 45 380 |
Total OwnerâsEquity | 128 000 | 145 480 |
Required:
Prepare Ratio Analysis based on the formula distributed toyou
Make comments about how to improve the business performance.
Note:
All sales are on credit. Accounts receivable balance on1/07/2011 was $66 800 and Business works 5 days a week.
Retained Profit = Net Profit â Dividend paid
Formula:
Current ratio = Current assets/Currentliabilities
Liquid ratio = Current assets âInventory (Closing Stocks)/Current liabilities â Bank overdraft
Gross profit ratio = Grossprofit/Sales
Net profit ratio = Net profit aftertax/Sales
Accounts receivable rate = Creditsales/Average accounts receivable Collection days = 365 days /Accounts receivable rate
Return on equity = Net profit aftertax/Owners equity Debt to Equity = Total debt/Equity
Total asset turnover = Totalsales/Total assets
Return on investment (ROI) = Netprofit after tax/Total assets Inventory turnover = Cost of Goodssold/Average Inventories Times Interest cover = Net Profit beforeInterest & tax / Interest
Earnings per share = (Net profitbefore tax â Preference Dividend) / Number of Ordinary shares
Ratio(Formula) | 2012 | 2013 | Interpretation |
Ratio(Formula) | 2012 | 2013 | Interpretation |
Ratio(Formula) | 2012 | 2013 | Interpretation |
Ratio(Formula) | 2012 | 2013 | Interpretation |

Write an assessment of the company's financial performance,using ratios to support your conclusion. What can you concludeabout the company's liquidity, solvency, and profitability? Be sureto include the ratios calculation to support your conclusion.
Use the financial statements provided below to calculate thefollowing financial ratios:
| 2012 | 2011 | |
| 1. Current Ratio | 10.915 | 6.715 |
| 2. Quick Ratio | 11.307 | 7.524 |
| 3. Long-Term Debt-to-Equity Ratio | 2.785 | 3.834 |
| 4. Debt-to-Equity Ratio | 2.785 | 3.834 |
| 5. Long-Term Debt Ratio | 2.866 | 3.988 |
| 6. Accounts Receivable Turnover Ratio (Assume that60% of Sales are Credit | 25.491 | 8.908 |
| 7. Inventory Turnover Ratio (Assume 2011 beginninginventory was -0-.) | -0.715 | -0.450 |
| 8. Asset Turnover Ratio | 0.163 | 0.076 |
| 9. Gross Profit Percentage | 0.731 | 0.806 |
| 10. Net Profit Margin Percentage | 0.375 | 0.311 |
| 11. Return on Assets | 0.061 | 0.024 |
| 12. Return on Equity | 0.237 | 0.118 |
Get Your Motor Runnin'
Compartive Balance Sheets
| 2012 | 2011 | |
| Assets | ||
| Current Assets | ||
| Cash | $198,456 | $147,333 |
| Accounts Receivable | 4,000 | 5,000 |
| Allowance for Uncollectible Accounts | (250) | 80 |
| Supplies | 200 | 250 |
| Inventory | 35,000 | 32,000 |
| Total current assets | 237,406 | 184,663 |
| Property, Plant, and Equipment | ||
| Equipment | 60,000 | 15,000 |
| Accumulated Depreciation - Equipment | (14,000) | (1,000) |
| Vehicles | 35,000 | 35,000 |
| Accumulated Depreciation - Vehicles | (4,800) | (2,400) |
| Building | 684,375 | 684,375 |
| Accumulated Depreciation - Building | (25,000) | (12,500) |
| Land | 46,875 | 46,875 |
| Land Improvements | 23,750 | 23,750 |
| Accumulated Depreciation - Land Improvements | (2,539) | (663) |
| Total PP&E | 803,661 | 788,437 |
| Total Assets | $1,041,067 | $973,100 |
| Liabilities and Stockholders' Equity | ||
| Current Liabilities | ||
| Accounts Payable | $20,000 | $24,000 |
| Wages Payable | 1,000 | 500 |
| Warranties Payable | 750 | 500 |
| Notes Payable | 0 | 2,500 |
| Total current liabilities | 21,750 | 27,500 |
| Long-term Liabilities | ||
| Bonds Payable | 750,000 | 450,000 |
| Mortgage Payable | 0 | 300,000 |
| Total long-term liabilities | 750,00 | 750,000 |
| Total liabilities | 771,750 | 777,500 |
| Stockholder's Equity | ||
| Common Stock | 125,000 | 125,000 |
| Paid-in capital in excess of par - common | 25,000 | 25,000 |
| Preferred Stock | 40,000 | 20,000 |
| Paid-in capital in excess of par - preferred | 25,000 | 15,000 |
| Less: Treasury Stock | (3,000) | (3,000) |
| Paid-in capital - treasury stock | 500 | 500 |
| Retained Earnings | 56,817 | 13,100 |
| Total stockholders' equity | 269,317 | 195,600 |
| Total liabilities and stockholders' equity | $1,041,067 | $973,100 |
Get Your Motor Runnin'
Comparative Income Statements
| 2012 | 2011 | |
| Service Revenue | $93,693 | $50,230 |
| Sales | 76,250 | 24,000 |
| Cost of Goods Sold | (45,750) | (14,400) |
| Gross Margin | $124,193 | $59,830 |
| Operating Expenses: | ||
| Advertising Expense | $7,500 | $5,000 |
| Bad Debt Expense | 330 | 0 |
| Depreciation Expense - Equipment | 13,000 | 5,667 |
| Depreciation Expense - Vehicles | 2,400 | 2,400 |
| Depreciation Expense - Building | 12,500 | 12,500 |
| Depreciation Expense - Land Improvements | 1,876 | 663 |
| Wages Expense | 22,870 | 10,500 |
| Total Expenses | 60,476 | 36,730 |
| Net Income | $63,717 | $23,100 |

