BUSS1020 Lecture Notes - Lecture 2: Contingency Table, Categorical Variable, Frequency Distribution

18 Jul 2018
School
Department
Course
Professor
Document Summary
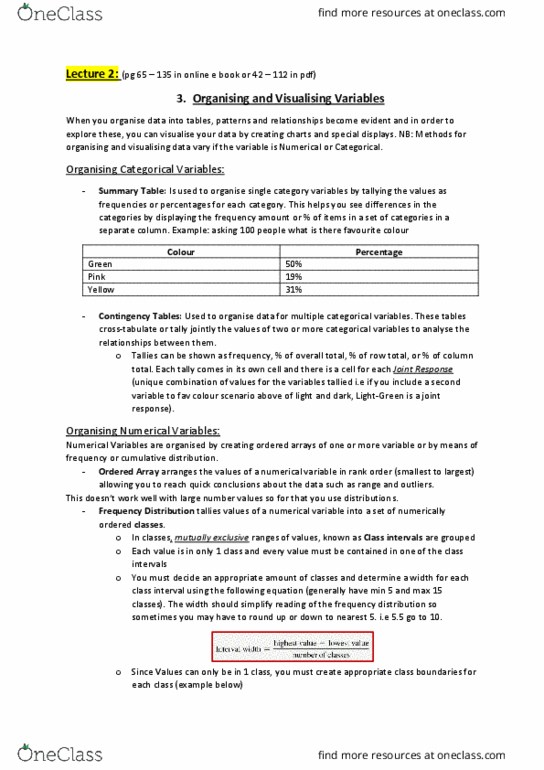
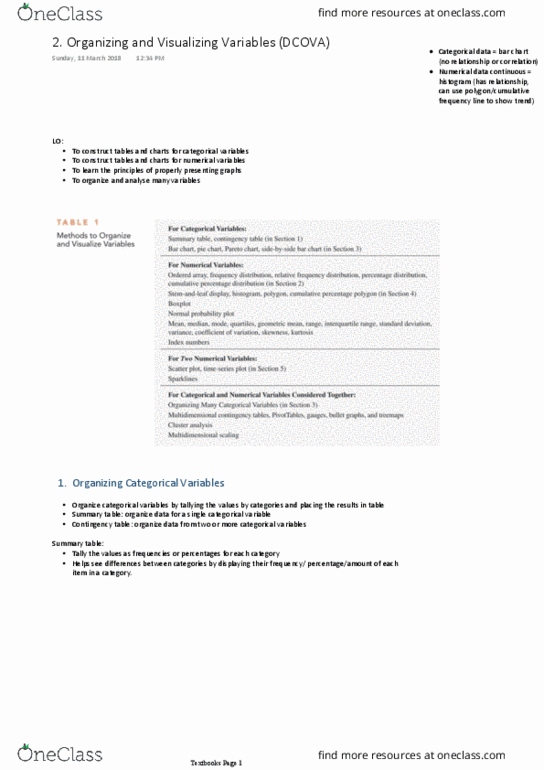
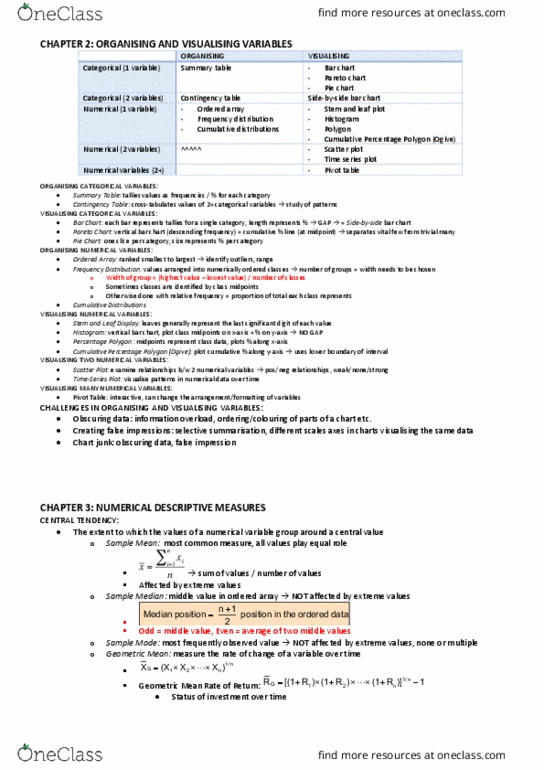
Lecture 2: organising and visualising variables: text pages 37-107. The dcova third and fourth tasks, organize and visualise the variables, are often done together. When so combined, the organise and visualize tasks can sometimes help jumpstart the analysis task by enabling a decision-maker to reach preliminary conclusions about data that can be tested during the analyse task. You organise categorical variables by tallying the values of a variable by categories and placing the results in tables. Typically, you construct a summary table to organise the data for a single categorical variable and you construct a contingency table to organize the data from two or more categorical variables. A summary table tallies the values as frequencies or percentages for each category. A summary table helps you see the differences among the categories by displaying the frequency, amount, or percentage of items in a set of categories in a separate column.