BUSS1040 Lecture Notes - Lecture 3: Economic Equilibrium, Ceteris Paribus, Midpoint Method

28 May 2018
School
Department
Course
Professor

WEEK 3: DEMAND, MARKET EQUILIBRIUM AND ELASTICITY
CHAPTER 6: DEMAND
• Law of demand: as price increases, demand decreases and vice versa
• Consumer behaviour = assume consumer will maximise utility received from G+S, subject to budget constraints
• Competitive markets: actions of individuals CANNOT affect the price in the market = price takers
BENEFIT AND WILLINGNESS TO PAY
• A consumer derives benefit from consuming G/S à measured through willingness to pay (WTP)
o i.e. Max price consumer would pay = benefit ($$ terms)
• When a consumer buys multiple units of a good, need to distinguish b/w total + marginal
benefit
o Total benefit (TB): sum of marginal benefit
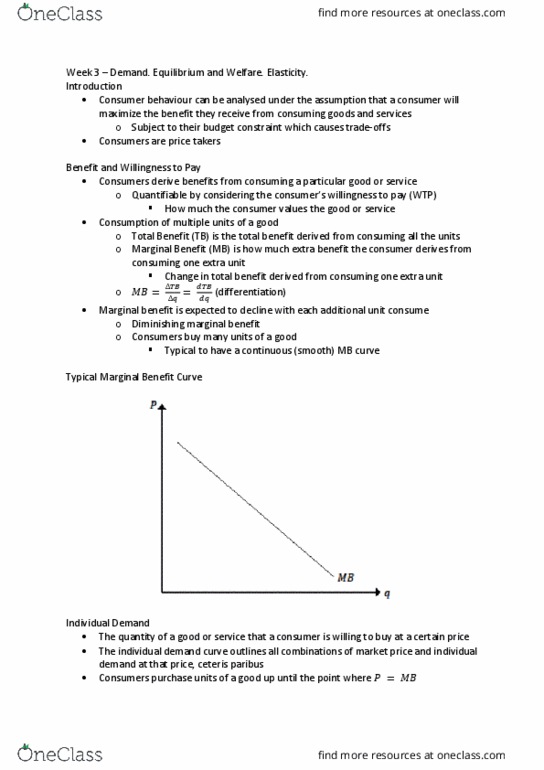
o Marginal benefit (MB): additional benefit from consuming one more unit of a G/S
§ Diminishing MB: with each additional unit consumed, MB declines
o E.g. A’s willingness to pay for coffee is $4 for 1st cup, $3 for 2nd, $2 for 3rd
§ TB = $9
§ MB = $4 for 1st, $3 for 2nd, $2 for 3rd
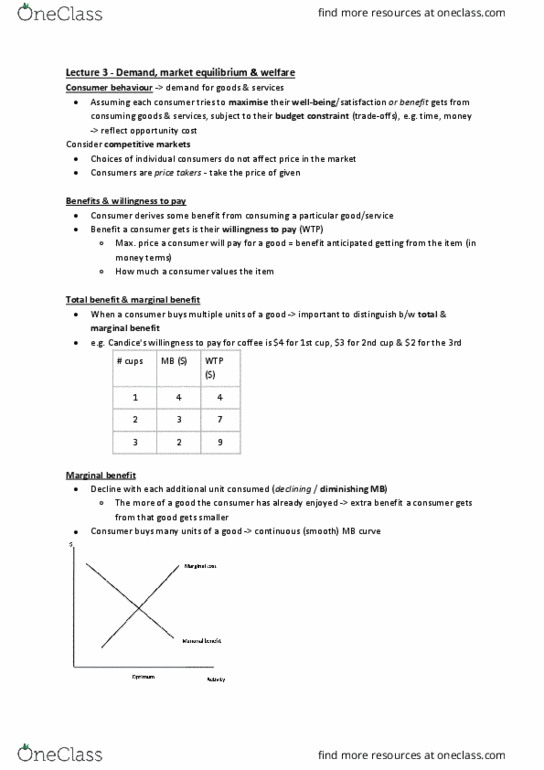
• GRAPH: continuous, downward-sloping line
INDIVIDUAL DEMAND
• We can use a consumer’s marginal benefit curve to derive his individual demand curve
• Individual demand: quantity of G/S a consumer is willing and able to buy at a price
o GRAPH: traces all combinations of market price + individual demand, ceteris paribus
o Max price consumer will pay = benefit they gain
§ A consumer will purchase units until
T = !"
à diminishing MB
•
T < !"
= consumer should buy b/c WTP > price
•
T > !"
= consumer should not buy it
• Law of demand: consumer consumes fewer units when price is higher
o GRAPH: Downward sloping curve à negative relationship
• Movement ALONG a demand curve: change in price/quantity
o Downwards movement along curve = increase in quantity demanded
o Upwards movement along curve = decrease in quantity demanded
• Movement OF the demand curve: change in any other factor e.g. tastes, income etc.
o Shift to left (D2 to D1) = increase in demand
o Shift to left (D1 to D2) = decrease in demand
MARKET DEMAND
• We use an individual consumer’s demand curve to derive the market demand curve
• GRAPH: traces combinations of Pm + Qm that ALL CONSUMERS in a market are together willing and able to buy at
that price
o Derived by adding together QD by each individual consumer at each price
§ E.g. Market price of apples is $4 and there are only two consumers in the market.
• At this price, S is willing to buy 6 apples + E 3 apples
• This means that at $4, total quantity demanded is 9 apples
§ Market demand curve is the horizontal summation of individual demand (MB) curves along q-axis