PSYC1001 Lecture Notes - Lecture 5: Statistical Inference, Frequency Distribution, Sampling Distribution

19 May 2018
School
Department
Course
Professor

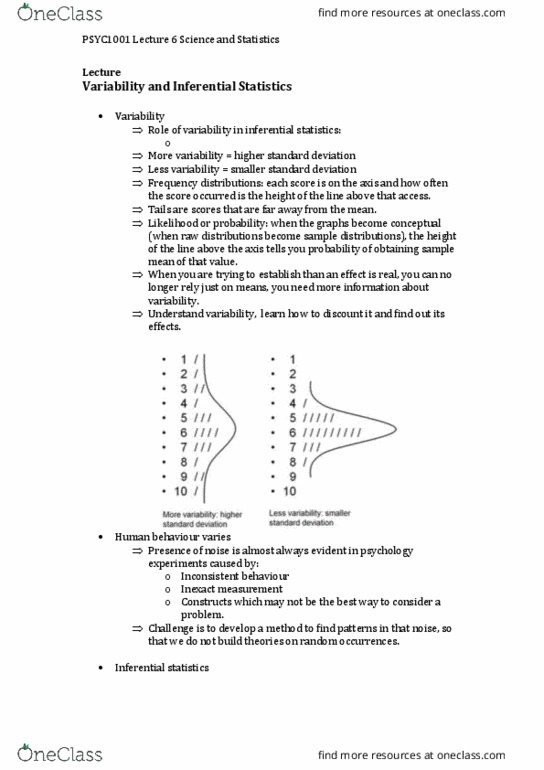
Variability and inferential statistics
Screen clipping taken: 7/06/2017 3:36 PM
Frequency distributions
• When graphs become conceptual, height of line above axis indicates likelihood or prob of
obtaining a sample mean of that value
Screen clipping taken: 7/06/2017 3:37 PM
Noisy human behaviour
• Human behaviour varies
• Noise = inconsistent behaviour, inexact measurement, constructs
find more resources at oneclass.com
find more resources at oneclass.com

Inferential stats
• Take sample from a population
• Run study on this sample
• Can we infer from differences/findings/effects in sample, that there are
differences/findings/effects in the population? (main question)
• on the basis of what we have observed in our sample -> we can make this conclusion about
the pop
• Can no longer rely on means, need more info about variability
• Difference between samples and populations
samples
Populations
• A selection from entire collection
you are interested in
• Properties of scores = statistics and
use latin, normal letters e.g. mean
= M, standard deviation = s/SD
• Entire collection in which you are
interested
• Properties of scores called
parameters and use greek letters
e.g. mean = u, standard deviation
= sigma
Distributions: raw scores
• Based on real set of data
• Frequency distribution of actual raw scores
Screen clipping taken: 7/06/2017 3:46 PM
Sampling distribution
• Calculating M (mean) from many samples
• Graphing all means to produce a single SAMPLE mean (u)
• Hypothetical distribution based on hypothetical set of sample means
• Each point on x axis = sample mean value
• Height of line = frequency of each sample mean
find more resources at oneclass.com
find more resources at oneclass.com
Document Summary
Frequency distributions: when graphs become conceptual, height of line above axis indicates likelihood or prob of obtaining a sample mean of that value. Noisy human behaviour: human behaviour varies, noise = inconsistent behaviour, inexact measurement, constructs. Populations: a selection from entire collection, entire collection in which you are you are interested in interested, properties of scores = statistics and use latin, normal letters e. g. mean. = m, standard deviation = s/sd: properties of scores called parameters and use greek letters e. g. mean = u, standard deviation. Distributions: raw scores: based on real set of data. Shape tends to be normal distribution: hypothetical sample mean = cluster in center/ pop mean, tails/low lines far from pop mean -> less likely to diverge greatly from pop mean. Shape = symmetrical, unimodal: approx 2/3 of scores fall within one sd of mean, not all sampling distributions normal.