BIOL 1090 Lecture Notes - Lecture 6: Confidence Interval

3 Nov 2016
School
Department
Course
Professor
Document Summary
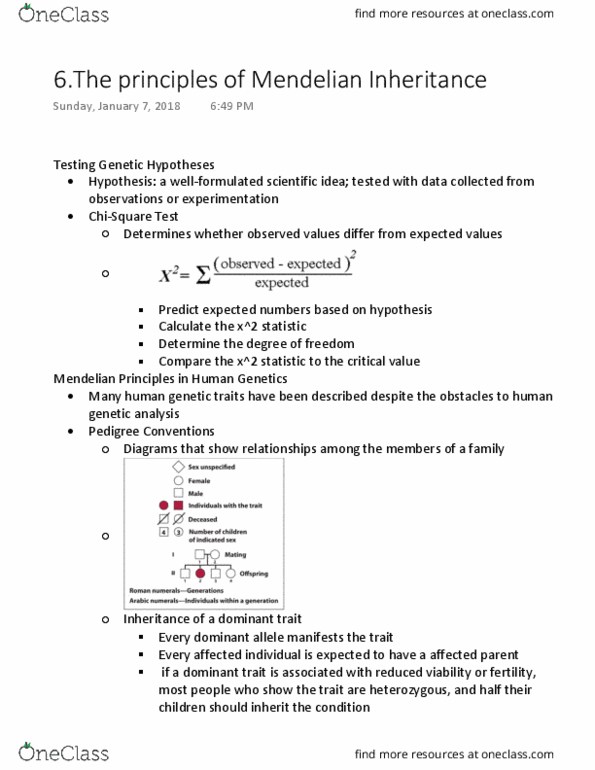
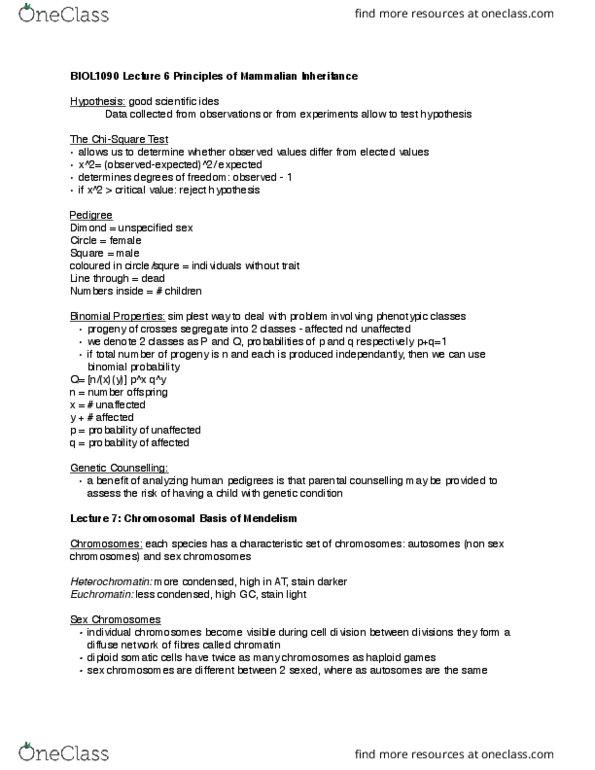
It is also data collected from observations/experiments which enable scientists to test data. D. o. f= n-1 where n is the number of classes. for instance. phenotype: brown dog, white dog, grey dog, tri-coloured dog. It allows us to determine whether the observed values are different than our expected values. Assume that you have crossed pure breeding plants of genotype a/a, b/b, a/a, b/b and obtained di-hybrid a/a, b/b. You then test crossed this to a/a, b/b. The resulting f1 generation matrix of the offspring was: H0 = the resulting f1 generation is in accordance with the established theory (1:1:1:1). H1 = the resulting f1 generation is not in accordance with the established theory. Lecture 6 df=3 [{df=(r-1) x (c-1)} , in this case r=type of genotypes in study i. e. a/b, a/b, a/b and a/b and c=no. of conditions in which genotypes are being studies (viz. observed values and expected values. ) Find the 2 value from chi square table at df=3.