SOAN 2120 Lecture Notes - Lecture 20: General Linear Model, Descriptive Statistics, Dependent And Independent Variables

16 Mar 2015
School
Department
Course
Professor

Document Summary
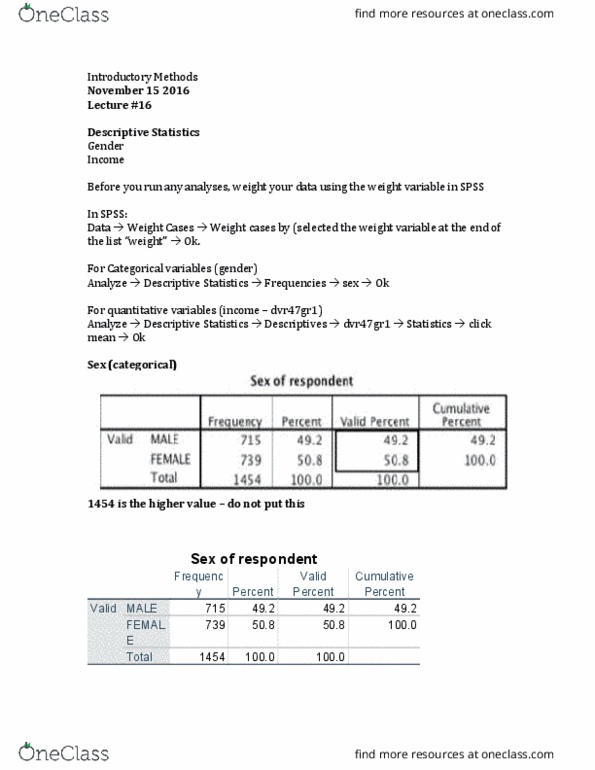
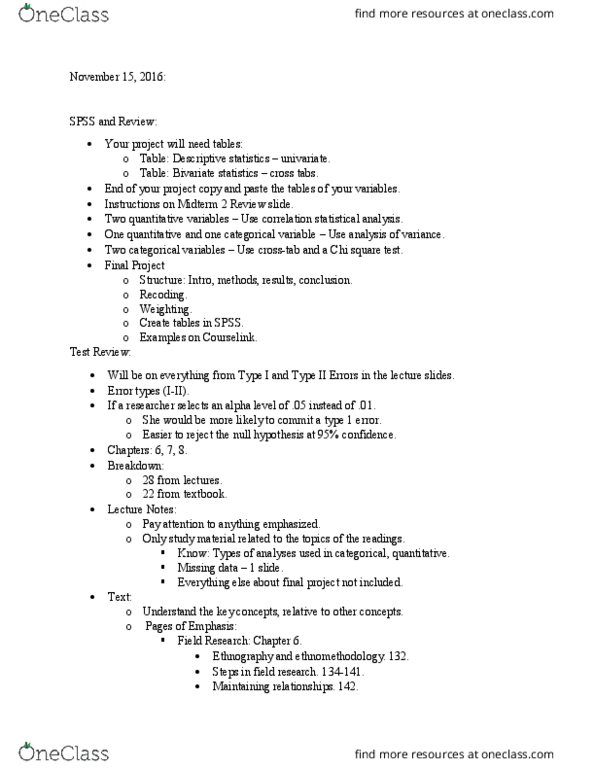
In your project you will be required to include 2 tables: Table: bivariate statistics (i. e. cross-tabs, comparing means or correlations) The table you use for whatever you are testing in your paper. Before you run any analyses, weight your data (!!) using the weight variable in spss. Data > weight > weight cases by (select weight variable) weight > Analyze > descriptive statistics > frequencies > sex > ok. Analyze > descriptive statistics > frequencies > income > statistics > click mean > ok. For quantitative variables sometimes we need to know the way in which the variable is coded. Interpret your results of the mean category. In the spss data editor go to the variable view. Nd the variable (dvr47gr1) and click on values. This will give you a list of the correspondence between the coded values and actual. Thus, the mean (category) corresponds with ,000-,999 (note: the analysis includes earnings those without any income - category 0)