ENVS178 Lecture Notes - Lecture 4: Ogive, Frequency Distribution

15 Jun 2015
School
Department
Course
Professor
Document Summary
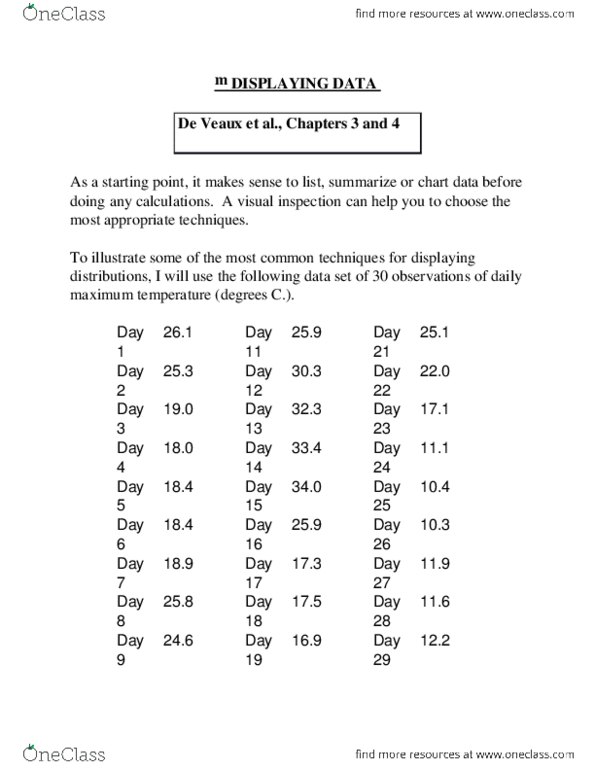
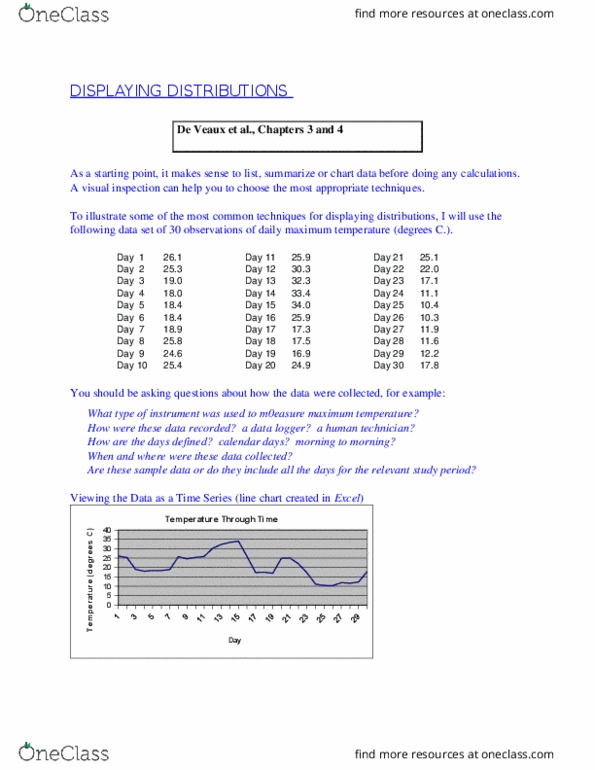
Ask questions about how data was collected. Ordered array: reorder the observations in ascending order. Stem and leaf displays: give an overall impression of the frequency distribution. Stems: as many digits as needed to represent the data. Stemplot: place the smallest values closest to the stem. The appropriate number of stems depends on number of observations and study purpose. Advantages of stemplot: quick idea of distribution. Stemplots can be used to compare two different distributions. Group the observations into classes and count. Open classes generally not a good idea. Decide how many classes you will use, decide on class intervals, establish class boundaries(make sure each data point goes in only one class) If a data set has many observations its common to convert the absolute frequencies into percent frequencies.