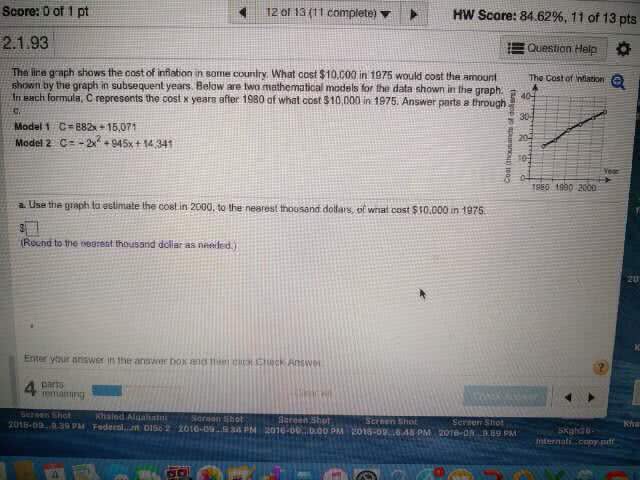
Score: 0 of 1 pt 12 of 13 (11 complete) â¼ ã HW Score: 84.62%, 1 1 of 13 pts 2.1.93 Question Help * The lire graph shows the cost of inflation in some country, What cost $10.C00 in 1975 would cost the amount The Cost of intiaton shown by the graph in subsequent years. Below are lwo mathematical models for the data shown in the graph. In each formula, C represents the cost k years after 1980 af what cost $10,000 in 1975. Answer parts a through C, : Model C#882x +15,071 Model 2 C--2x2 -945x+ 14 341 195a 1990 2000 a. Use the graph to estimate the cost in 2000, to the nearest thousand dollars, of what cost $10.000 in 1975. Round to the nearest thousand doliar as needed) 20 Enter your answer is the answer box and then chck Check Answ 4 t remaining haled Alahatn Federal.lt Dise2 screen Shot 2016-09-.6A1 2015-0a..R 39 p" Sereer Sho 2010-D.ì 34 PM 2016-09." DOO pM nternaticopy pdr