PSY 350 Lecture Notes - Lecture 10: Triangular Matrix, Apa Style, List Of Statistical Packages

Document Summary
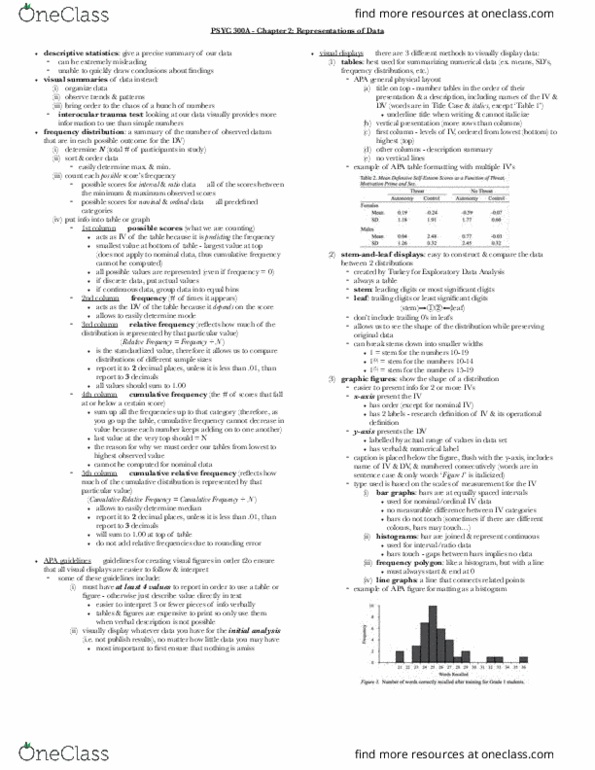
If you need to present three or fewer numbers, first try using a sentence. If you need to present four to 20 numbers, first consider using a well-prepared table. If you have more than 20 numbers, a graph is often more useful than a table. Do not present full output from your statistical software. Usually, put predictors or conditions in rows and outcomes in columns. Columns are grouped logically so that we can easily compare what we"re most interested in. This varies depending on our main questions and our purpose. In apa style, tables use only horizontal lines( rules ) not vertical lines. Use them sparingly at top and bottom, under headings, and to set off major comparisons. In word, use view gridlines to set up your table the way you want it, then add your horizontal lines at the end. Always include a table that presents the means, sds, and correlations among all major study variables.