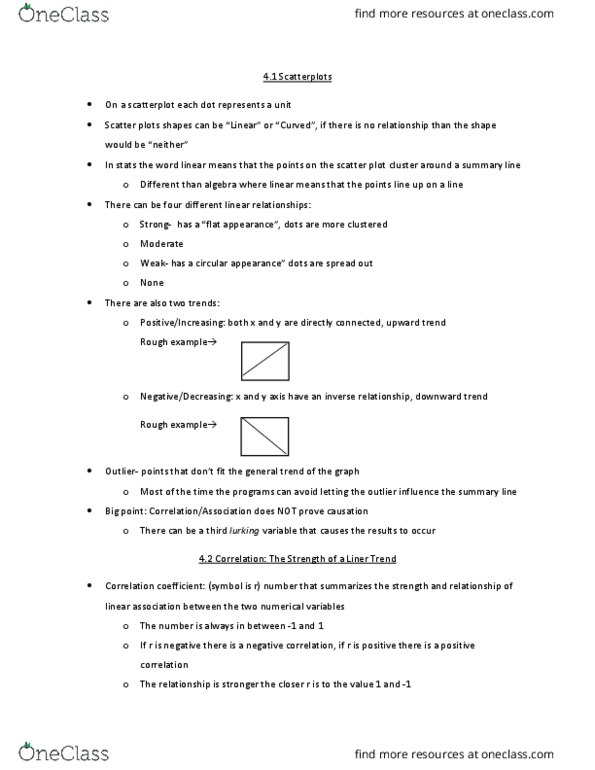
MATH 140 Lecture Notes - Lecture 21: Scatter Plot


04-26-16 Notes
- Correlation and regression
- Height and weight? Yes
- Income and expenditure? Yes
- Education and income? Yes
o You need to know what the strength of the relationship is
- R = coefficient relationship
- Line of regression describes the relationship
- Perfect (+) relationship r = 1
- Perfect (-) relationship r = -1
- Scatterplot -1 ≤ r ≤ 1
- Example
o X = speed of car
o Y = gas consumption
§ Scatter diagram: the closer the dots, the stronger the relationship, but not
perfect
- Formulas
o R = (!!! !"#)(!!! !"#)
(!!! !"#)(!!! !"#)
o ye = mx + b
o b = y bar – (m)(x bar)
o m = (r)(!!
!!
)
o σy = (!!! !"#)!
!!!
o σx = (!!! !"#)!
!!!
o Sy"x = 𝜎!1−𝑟!