STA 2023 Lecture Notes - Lecture 7: Frequency Distribution, Ogive, Upper Class

Document Summary
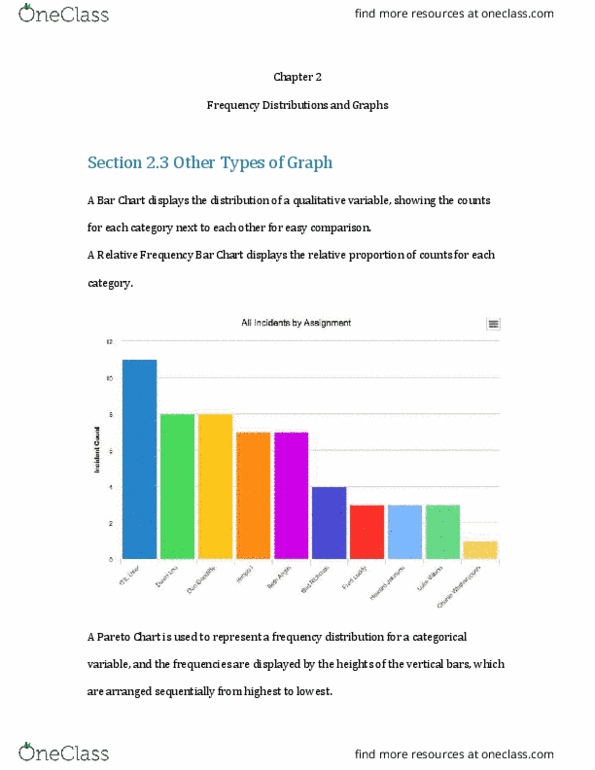
3 most common graphs in research: histogram, frequency polygon, cumulative frequency polygon (ogive) The histogram is a graph that displays the data by using vertical bars of axis heights to representative frequencies of the classes. The class boundaries are represented on the horizontal axis. Construct a histogram to represent the data for the stories in the world"s tallest buildings (see example 2 for the data) The frequency polygon is a graph that displays the data by using lines that connect points plotted for the frequencies at the class midpoints. The frequencies are represented by the heights of the points. The class midpoints are represented on the horizontal axis. Construct a frequency polygon to represent the data for the stories in the world"s tallest buildings (see example 2 for the data) frequency. The ogive is a graph that represents the cumulative frequencies for the classes in a frequency distribution. The upper class boundaries are represented on the horizontal axis.