STA 2023 Lecture Notes - Lecture 43: Explained Variation, Total Variation, Standard Deviation


Chapter 10
Correlation and Regression
Section 10.3 Coefficient of Determination and Standard
Error of the Estimate
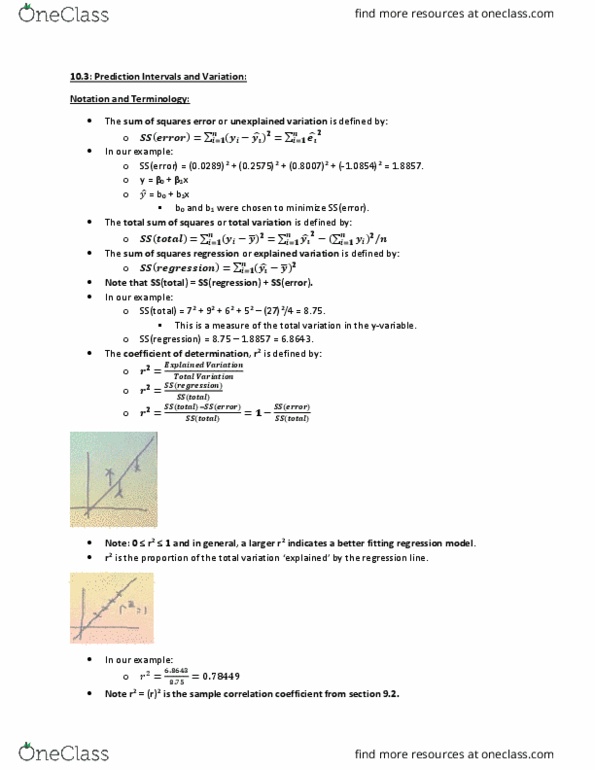
The total variation is the sum of the squares of the vertical distances each point is
from the mean.
The total variation can be divided into two parts: that which is attributed to the
relationship of x and y, and that which is due to chance.
Variation
The variation obtained form the relationship i.e., from the predicted y’values ad
called the explained variation.
Variation due to chance is called he unexplained variation. This variation cannot
be attributed to the relationship.
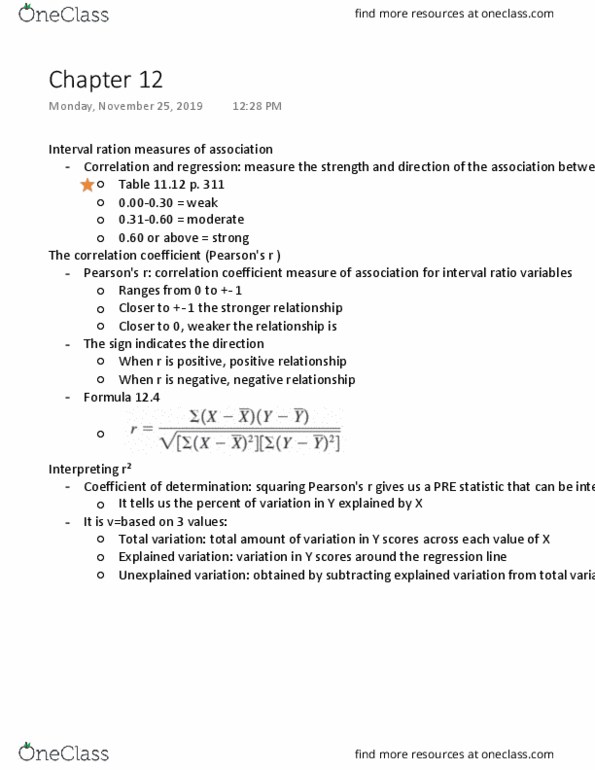
Coefficient of Determination
The coefficient of determination is the ration of the explained variation to the
total variation.
The symbol for the coefficient of determination is r^2.
find more resources at oneclass.com
find more resources at oneclass.com
Document Summary
The total variation is the sum of the squares of the vertical distances each point is from the mean. The total variation can be divided into two parts: that which is attributed to the relationship of x and y, and that which is due to chance. The variation obtained form the relationship (cid:523)i. e. , from the predicted y"values(cid:524) ad called the explained variation. Variation due to chance is called he unexplained variation. This variation cannot be attributed to the relationship. The coefficient of determination is the ration of the explained variation to the total variation. The symbol for the coefficient of determination is r^2. Another way to arrive at the value for r^2 is to square the correlation coefficient. The coefficient of nondetermination is a measure of the unexplained variation. The formula for the coefficient of nondetermination is 1. 00-r^2. The standard error of the estimate is the standard deviation of the observed y values about the predicted y" values.