PSYC 31141 Lecture Notes - Lecture 9: Additive Synthesis, Ossicles, Middle Ear

19 Oct 2019
School
Department
Course
Professor

Chapter 9:
Sound, The Auditory System,
and Pitch Perception
Overview of Questions
If a tree falls in the forest and no one is there to hear it, is there a sound?
What is it that makes sounds high pitched or low pitched?
How do sound vibrations inside the ear lead to the perception of different pitches?
How are sounds represented in the auditory cortex?
Pressure Waves and Perceptual Experience
Two definitions of “sound”
Physical definition - sound is pressure changes in the air or other medium.
Perceptual definition - sound is the experience we have when we hear.
Sound Waves
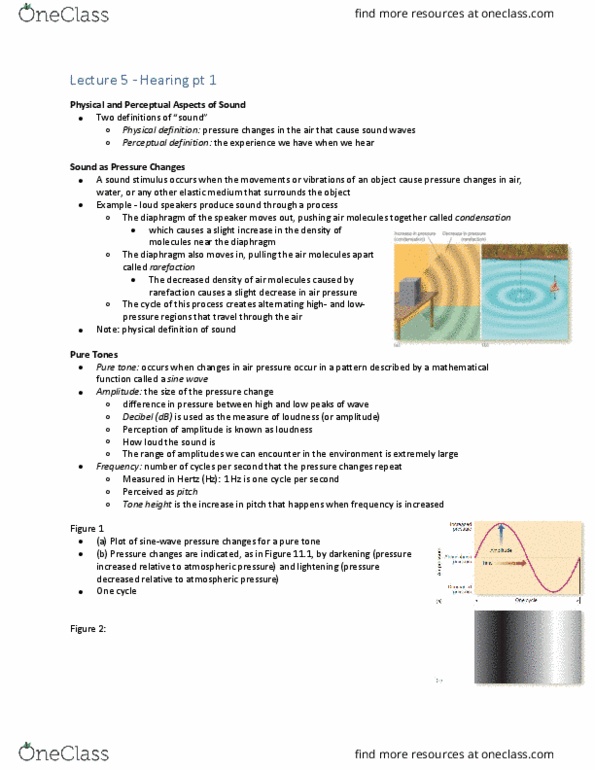
Loud speakers produce sound by:
The diaphragm of the speaker moves out, pushing air molecules together called
condensation.
The diaphragm also moves in, pulling the air molecules apart called rarefication.
The cycle of this process creates alternating high- and low-pressure regions that
travel through the air.
Figure 11.1 (a) The effect of a vibrating speaker diaphragm on the surrounding air. Dark areas
represent regions of high air pressure, and light areas represent areas of low air pressure.
Figure 11.1
(b) When a pebble is dropped into still water, the resulting ripples appear to move outward.
However, the water is actually moving up and down, as indicated by movement of the boat. A
similar situation exists for the sound waves produced by the speaker in (a).
Sound Waves - continued
Pure tone - created by a sine wave
Amplitude - difference in pressure between high and low peaks of wave
Perception of amplitude is loudness
Decibel (dB) is used as the measure of loudness
The decibel scale relates the amplitude of the stimulus with the
psychological experience of loudness.
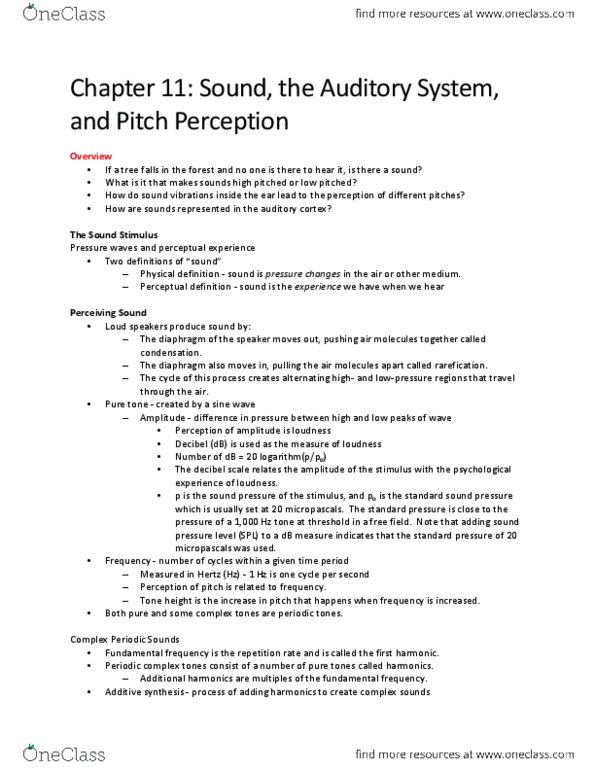
Figure 11.2 (a) Plot of sine-wave pressure changes for a pure tone; (b) Pressure changes are
indicated, as in Figure 11.1, by darkening (pressure increased relative to atmospheric pressure)
and lightening (pressure decreased relative to atmospheric pressure.)
Figure 11.3 Three different amplitudes of a pure tone. Larger amplitudes are associated with
the perception of greater loudness.
Relative amplitudes and decibels for environmental sounds
Sound Waves - continued
Frequency - number of cycles within a given time period
Measured in Hertz (Hz) - 1 Hz is one cycle per second
Perception of pitch is related to frequency.
Tone height is the increase in pitch that happens when frequency is increased.
Three different frequencies of a pure tone.

Higher frequencies are associated with the perception of higher pitches.
All pitches are same loudness (amplitude).
Complex Periodic Sounds
Fundamental frequency is the repetition rate and is called the first harmonic.
Periodic complex tones consist of a number of pure tones called harmonics.
Additional harmonics are multiples of the fundamental frequency.
Complex Periodic Sounds - continued
Additive synthesis - process of adding harmonics to create complex sounds
Frequency spectrum - display of harmonics of a complex sound
Attack of tones - buildup of sound at the beginning of a tone
Decay of tones - decrease in sound at end of tone
Left: Waveforms of (a) a complex periodic sound with a fundamental frequency of 200 Hz; (b)
fundamental (first harmonic) = 200 Hz; (c) second harmonic = 400 Hz; (d) third harmonic = 600
Hz; (e) fourth harmonic = 800 Hz. Right: Frequency spectra for each of the tones on the left.
(Adapted from Plack, 2005)
Complex Periodic Sounds - continued
Timbre - all other perceptual aspects of a sound besides loudness, pitch, and duration
It is closely related to the harmonics, attack and decay of a tone.
Figure 11.10 Frequency spectra for a guitar, a bassoon, and an alto saxophone playing a tone
with a fundamental frequency of 196 Hz. The position of the lines on the horizontal axis
indicates the frequencies of the harmonics and their height indicates their intensities.
Musical Scales and Frequency
Letters in the musical scale repeat.
Notes with the same letter name (separated by octaves) have fundamental frequencies
that are multiples of each other.
These notes have the same tone chroma.
We perceive such notes as similar to one another.
Figure 11.8 A piano keyboard, indicating the frequency associated with each key. Moving up
the keyboard to the right increases the frequency and tone height. Notes with the same letter,
like the A’s (arrows) have the same tone chroma.
Range of Hearing
Human hearing range - 20 to 20,000 Hz
Audibility curve - shows the threshold of hearing in relation to frequency
Changes on this curve show that humans are most sensitive to 2,000 to 4,000 Hz.
Auditory response area - falls between the audibility curve and the threshold for feeling
It shows the range of response for human audition.
Figure 11.9 The audibility curve and the auditory response area. Hearing occurs in the light
green area between the audibility curve (the threshold for hearing) and the upper curve (the
threshold for feeling). Tones with combinations of dB and frequency that place them in the
pink area below the audibility curve cannot be heard. Tones above the threshold of feeling
result in pain.
The Ear
Outer ear - pinna and auditory canal
Pinna helps with sound location.