ECON 1116 Lecture 4: Elasticity

Document Summary
Get access


Related Documents
Related Questions
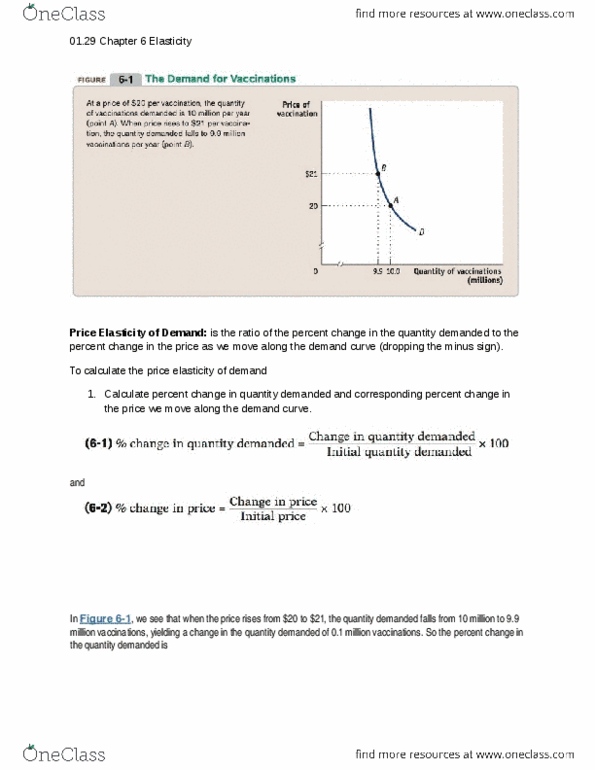
PROBLEM SET ONE -2 - PRICE-ELASTICITY OF DEMAND
|
| P1 | P2 | QD1 | QD2 | I | II | III | IV | V |
| 1 | 1 | 2 | 10 | 5 | |||||
| 2 | 5 | 3 | 40 | 90 | |||||
| 3 | 12 | 20 | 200 | 200 | |||||
| 4 | 3 | 2 | 9 | 9 | |||||
| 5 | 0.40 | 1.40 | 30 | 15 | |||||
| 6 | 1.2 | 4.0 | 20 | 15 | |||||
| 7 | 7.5 | 4.6 | 40 | 30 | |||||
| 8 | 5 | 5.000â¦01 | 1x10⁶ | 0 | |||||
| 9 | 5 | 4.9999â¦. | 10 | 1x10⁹ | |||||
| 10 | 6 | 12 | 12 | 6 | |||||
| 11 | 18 | 36 | 360 | 180 | |||||
| 12 | 7 | 15 | 24 | 16 | |||||
| 13 | 7 | 16 | 78 | 78 | |||||
| 14 | 25 | 65 | 150 | 100 | |||||
| 15 | 65 | 91 | 1300 | 780 | |||||
| 16 | 4 | 5 | 21 | 11 | |||||
| 17 | 8 | 4 | 30 | 54 | |||||
| 18 | 140 | 275 | 625 | 495 | |||||
| 19 | 78 | 91 | 780 | 780 | |||||
| 20 | 91 | 78 | 780 | 780 |
Column I - determine the Price-Elasticity of Demand Coefficient. Find material in Chapter 6 and the Powerpoint of Elasticity Chap 004 19e.ppt
change in quantity demanded change in price
ED = ---------------------------------------- â ----------------------------
sum of quantities demanded / 2 sum of prices / 2
The data in the first four columns represent price (P) and quantity demanded (Qd) in time 1 (before change in price) and time 2 (after change in price). Note that results should be expressed in absolute terms (see paragraph Elimination of Minus Sign). For example, -1 should be expressed as â1â.
Column II â Based on topic concerning Interpretations of ED, indicate which applies based on how the quantity demanded changed subsequent to a change in price (elastic, inelastic, etc.)
Column III - you need to determine if the good in question would be considered a necessity, a luxury or neither.
Column IV â Indicate, in monetary terms, how much is the change in total revenue or total expenditure (TR = P X QD), from the first price level to the second.
Column V - the direction of the change, also in monetary terms, that is, increasing or decreasing, and by how much? (show a + sign for increasing and a â sign for decreasing).
Note: for any monetary result please include the applicable currency symbol ($, â¬, etc.)

|
A |
B |
C |
D |
E |
|
|
1 |
|||||
|
2 |
|||||
|
3 |
Date |
Price of gas |
|||
|
4 |
Jan 07, 2008 |
325.3 |
|||
|
5 |
Jan 14, 2008 |
323.9 |
|||
|
6 |
Jan 21, 2008 |
320.1 |
|||
|
7 |
Jan 28, 2008 |
316.3 |
|||
|
8 |
Feb 04, 2008 |
313.5 |
|||
|
9 |
Feb 11, 2008 |
310.7 |
|||
|
10 |
Feb 18, 2008 |
315.4 |
|||
|
11 |
Feb 25, 2008 |
324.6 |
|||
|
12 |
Mar 03, 2008 |
325.2 |
|||
|
13 |
Mar 10, 2008 |
326.3 |
|||
|
14 |
Mar 17, 2008 |
333.7 |
|||
|
15 |
Mar 24, 2008 |
332.1 |
|||
|
16 |
Mar 31, 2008 |
334.8 |
|||
|
17 |
Apr 07, 2008 |
336.6 |
|||
|
18 |
Apr 14, 2008 |
341.6 |
|||
|
19 |
Apr 21, 2008 |
355 |
|||
|
20 |
Apr 28, 2008 |
366.9 |
|||
|
21 |
May 05, 2008 |
367.7 |
|||
|
22 |
May 12, 2008 |
376.4 |
|||
|
23 |
May 19, 2008 |
384.9 |
|||
|
24 |
May 26, 2008 |
397.5 |
|||
|
25 |
Jun 02, 2008 |
402.6 |
|||
|
26 |
Jun 09, 2008 |
407 |
|||
|
27 |
Jun 16, 2008 |
411.8 |
|||
|
28 |
Jun 23, 2008 |
411 |
|||
|
29 |
Jun 30, 2008 |
411.3 |
|||
|
30 |
Jul 07, 2008 |
412.3 |
|||
|
31 |
Jul 14, 2008 |
411.7 |
|||
|
32 |
Jul 21, 2008 |
408.4 |
|||
|
33 |
Jul 28, 2008 |
400.2 |
|||
|
34 |
Aug 04, 2008 |
393.9 |
|||
|
35 |
Aug 11, 2008 |
386.6 |
|||
|
36 |
Aug 18, 2008 |
376.4 |
|||
|
37 |
Aug 25, 2008 |
371.5 |
|||
|
38 |
Sep 01, 2008 |
369.8 |
|||
|
39 |
Sep 08, 2008 |
367.1 |
|||
|
40 |
Sep 15, 2008 |
373 |
|||
|
41 |
Sep 22, 2008 |
368 |
|||
|
42 |
Sep 29, 2008 |
362.7 |
|||
|
43 |
Oct 06, 2008 |
351.7 |
|||
|
44 |
Oct 13, 2008 |
323.9 |
|||
|
45 |
Oct 20, 2008 |
305 |
|||
|
46 |
Oct 27, 2008 |
286.1 |
|||
|
47 |
Nov 03, 2008 |
265.4 |
|||
|
48 |
Nov 10, 2008 |
247.7 |
|||
|
49 |
Nov 17, 2008 |
229.4 |
|||
|
50 |
Nov 24, 2008 |
212.8 |
|||
|
51 |
Dec 01, 2008 |
203 |
|||
|
52 |
Dec 08, 2008 |
191.8 |
|||
|
53 |
Dec 15, 2008 |
181 |
|||
|
54 |
Dec 22, 2008 |
178.1 |
|||
|
55 |
Dec 29, 2008 |
174.1 |
QUESTION 13
Label the next column (D) "6-month change." Here we will calculate how much prices have changed since the price six months ago. For example, if the price on January 1 were 224.1 and the price on July 1 is 324.1, the price change is 100. We can't calculate how much prices have changed over the past six months for the first half of 2008 because we don't know the price six months before. So, in column D, put an x in each cell for which we can't calculate the 6-month change. Starting in July, we can calculate the 6-month change. Using cell references, enter here the formula you should enter into cell D30 to calculate the 6-month change.
2 points
QUESTION 14
Copy and paste the formula from cell D30 (from the last question) into cells D31 to D55. What formula is now in cell D48?
2 points
QUESTION 15
What value is now in cell D50?
1 point
QUESTION 16
Label the next column (E) "% of Jan." In this column, we will divide every week's price by the price from January 7th. This will tell us as a percent how prices compare to their level at the start of the year. This time, we want an "absolute" reference so that it doesn't consider the position (i.e. "8 to the left and 2 down") but just locks in on B4 every time. To set up an absolute reference in a formula, we put the $ character into the reference, so instead of B4, we use $B$4. With the dollar signs in place, you can copy the formula and paste it, and in each case, it will go back to B4 regardless of where you are when you paste it. What formula should you type into cell E5 to get the "% of Jan" for January 14, 2008? Remember to use the absolute reference so it will be easy to copy later!
2 points
QUESTION 17
Copy and paste the formula from cell E5 into the rest of column E. (Well, at least from E6 down to E55.) What formula is now in cell E17?
