01:960:285 Lecture Notes - Lecture 8: Interquartile Range, Standard Score, Quartile
19 Oct 2016
School
Department
Course
Professor


60
01:960:285 Full Course Notes
Verified Note
60 documents
Document Summary
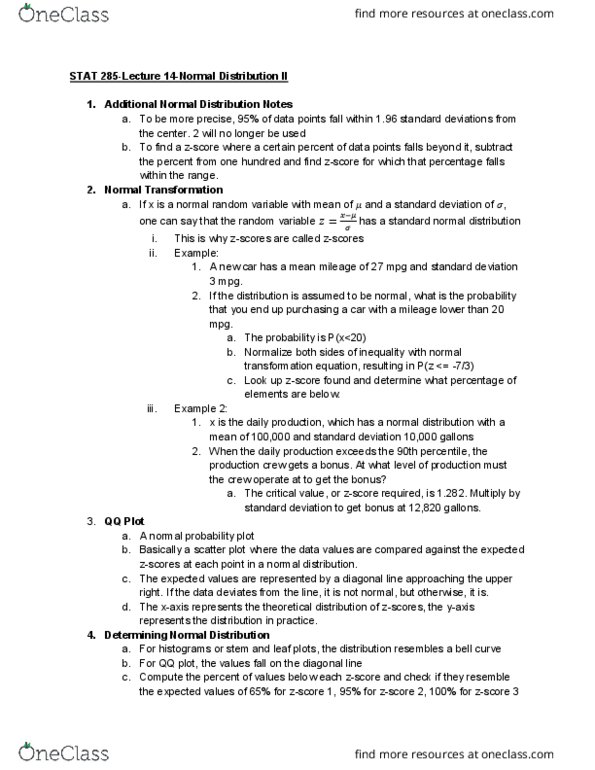
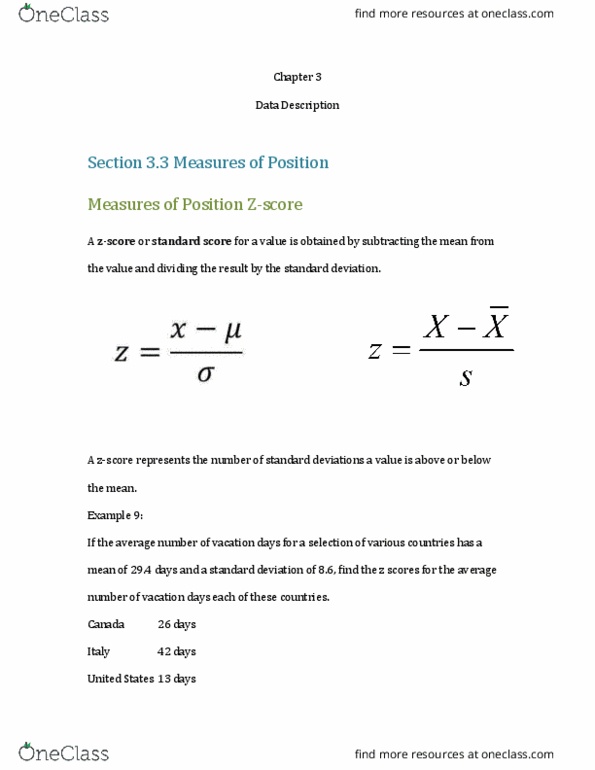
The standard score is obtained by subtracting the mean and dividing the difference by the standard deviation. The symbol is z, which is why it"s also called a z-score. The mean of the standard scores is zero and the standard deviation is 1. This is the nice feature of the standard score -- no matter what the original scale was, when the data is converted to its standard score, the mean is zero and the standard deviation is. The kth percentile is the number which has k% of the values below it. The data must be ranked: rank the data, find k% (k /100) of the sample size, n, if this is an integer, add 0. 5. If it isn"t an integer round up: find the number in this position. If your depth ends in 0. 5, then take the midpoint between the two numbers. It is sometimes easier to count from the high end rather than counting from the low end.