01:960:285 Lecture Notes - Lecture 25: Null Hypothesis, Test Statistic, Statistical Hypothesis Testing
20 Oct 2016
School
Department
Course
Professor


60
01:960:285 Full Course Notes
Verified Note
60 documents
Document Summary
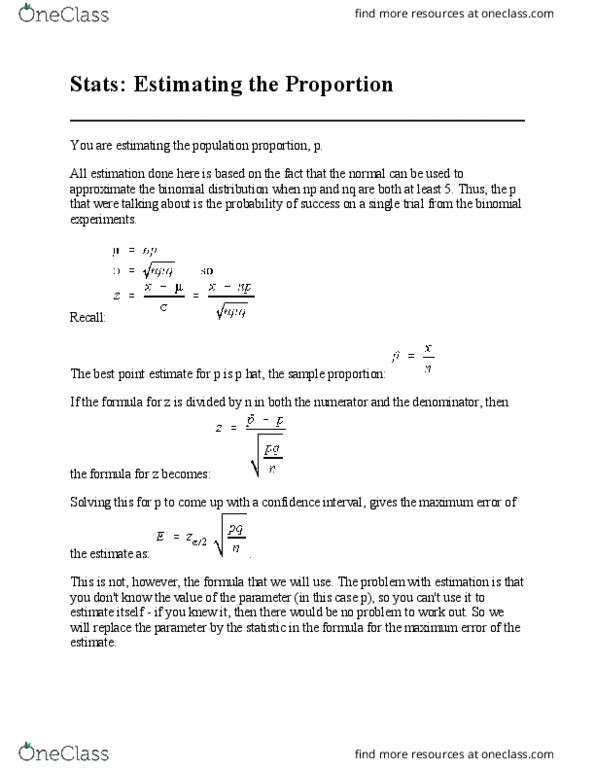
You are testing p, you are not testing p hat. If you knew the value of p, then there would be nothing to test. All hypothesis testing is done under the assumption the null hypothesis is true! The value for all population parameters in the test statistics come from the null hypothesis. This is true not only for proportions, but all of the testing we"re going to be doing. The population proportion has an approximately normal distribution if np and nq are both at least 5. Remember that we are approximating the binomial using the normal, and that the p we"re talking about is the probability of success on a single trial. The test statistic is shown in the box to the right. The critical value is found from the normal table, or from the bottom row of the t- table. The steps involved in the hypothesis testing remain the same.