ECON 20A Lecture Notes - Opportunity Cost, Time Series, Macroeconomics

Document Summary
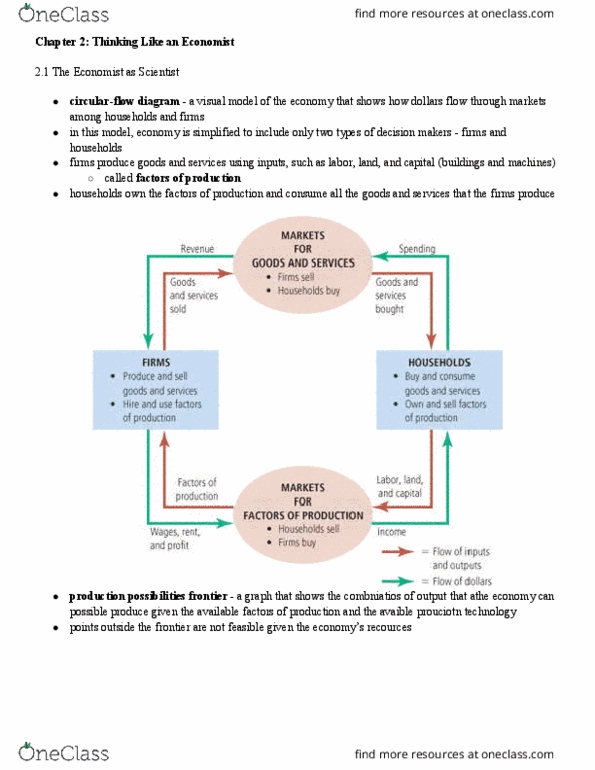
A. economic models a. the circular ow diagram. 2. visual representation of economy show how markets ow through rms and households. Rm sells household buys market for goods and services a. b. Markets for the factors of production a. b. household sells. B. b. the production possibility frontier demonstrates: scarcity, ef ecieny, trade off, opportunity cost how households and rms interact in a speci c market (e) housing costs in ny. A broader view of the economy deals with in ation, unemployment, economic growth. 2. both are closely intertwined c. positive versus normative analysis a. minimum wage laws cause unemployment positve is more observational in nature. 1. normative precribes how the world should be. C. time series graphs graphs of 2 variables. B. usefull for showing the relationship between variables (e) scatter plot that shows relationshp between study time and gpa a. (e2) a. postive correlation relationship between party time and gpa.