STATS 10 Lecture Notes - Lecture 6: Empirical Probability, Randomness, Sample Space


Chapter 5: Modeling Variation with Probability
What is Randomness?
● A scenario/experiment is random if its outcome cannot be predicted w/ certainty
○ An event is an outcome or set of outcomes from a random scenario
○ If the same scenario always hast he same outcome the scenario = deterministic
○ Coming up with “random” numbers or assigning people into groups at “random is usually not random
■ Whether it be people or computers, its’ difficult to generate randomness
● Computers follow an algorithm that generates pseudorandom numbers, starting from
the initial number (seed) that generates pseudorandom numbers from it
○ Seed can be set → gives us same random results every time
● For our purposes, pseudorandom numbers is random enough (not going to be tested)
○ Consider where the “randomness” is generated from rather than whether it “looks” random
● Probability: numeric way to measure how often random events occur → assign a number (proportion or percent)
that tells us how frequently we’d expect a random event to occur
○ E.g. probability to get heads in a coin flip = 50% or 0.5
○ Reminder that “relative frequency”=proportion/percentage of times a value is observed in a data set
○ Theoretical probabiities: long-run relative frequency; the relative frequency at which an event happens
after repeating an experiment infinitely many times
■ .e.g. Since a coin has two sides, then we would conclude the probability of seeing heads is 50%
■ Theoretical probabilities are not random and always have the same value → rely on
theory/assumptions that often cannot be computed directly
○ Empirical probabilities: relative frequencies based on experiment or observations; relative frequency at
which an event is observed in data
■ E.g. if we flip a coin and see heads 9 times, the empirical probability of seeing heads is 9/20 (0.45
or 45%)
■ Empirical probabilities are random, will vary from experiment to experiment
○ We can use empirical probabilities to estimate and test theoretical probabilities
■ Estimation: if we don’t know theoretical probability, can we predict it based on observation?
■ Testing: We make assumptions to computer theoretical probabilities (e.g. assumption that coin is
fair) but the assumptions could be incorrect/unreasonable); Do the empirical probabilities we
observe support or go against the assumptions we made?
Finding Theoretical Probabilities
● A probability/probability measure assigns a numer to an outcome from a random experiemnt/scenario that
measures the likelihood (chance) of that outcome happening
○ rules/axioms to assigning probabilities
■ Rule 1: probabilities represent relative frequencies, always a number between 0 → 1 (including 0
and 1)
● 0= event will never happen
● 1=event will always happen
● The converse of this is not always true (will elaborate more in chapter 6)
■ Rule 2: Since an event must either happen or not happen, the (probability of an event not
happening → probability of complement) = 1 - (probability of event happening)
● Complement of an event is the set of outcomes where the event does not happen
○ E.g. complement to “it will rain tomorrow” is “it will not rain tomorrow”
○ Complement of rolling a 6 on a die is rolling 1, 2, 3, 4, 5! → NOT getting 6
● Probability of rolling a 6 = ᪤; probability of not rolling a 6 is 1 - ᪤ = ᪥
○ Events are usually represented by uppercase letters (A B C)
■ P(A)=probability of event A; complement of event A is Ac
○ SUMMARY OF RULES:
find more resources at oneclass.com
find more resources at oneclass.com

■ Rule 1: 0 ≤ P(A) ≤ 1
■ Rule 2: P(Ac) = 1 - P(A)
● A random experiment or situation has equally likely outcomes if all possible outcomes occur w/ the same
frequency
○ Equally likely outcomes: flipping a coin, rolling a die, choosing a lottery number
○ Not equally likely outcomes: choosing a random letter from the word “STATISTICS” (more T’s than C’s)
○ The sample space (S) is a list that contains all possible outcomes of a random experiment
■ An event is any collection of outcomes in the sample space
■ RULE 3: If all possible outcomes are equally likely, then for any event A
● Probability of A = P(A) = (Number of outcomes in A)/(number of all possible outcomes)
○ E.g. rolling an even number on a die
■ Sample space: S= {1, 2,3, 4, 5, 6}
■ If A denotes the event of rolling an even number, A consists of 3 possible
outcomes → Number of outcomes in A = 3 (we can roll 2, 4, 6)
■ Number of all possible outcomes= 6 (we can roll 1, 2, 3, 4, 5, 6)
■ P(A) = 3/6 = ½ or 50%
● Combining events
○ Different events often have outcomes in common
■ E.g. when rolling a die, event of rolling an even number under 5 has two outcomes in common
(rolling a 2 and rolling a 4)
■ If we pick a person at random, the event that the person wears glasses and the event that the
person haslong hair overlap (there are people who wear glasses AND have long hair)
■ Events often describe single attributes (e.g. wearing glasses or having long hair) → combining
them in different way s allows us to consider events that describe multiple attributes and find their
probabilities
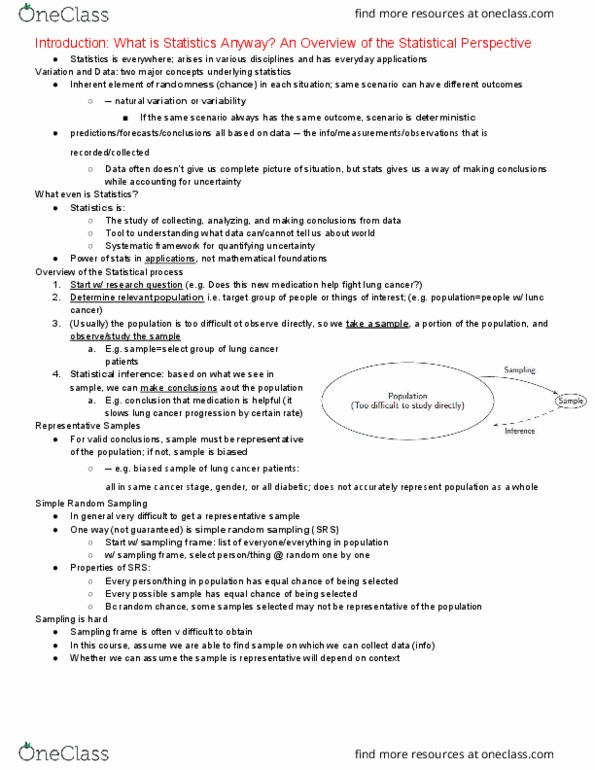
● Venn Diagram: uses circles to represents groups (sets) of objects (or outcomes, in this case) → circles overlap
where outcomes overlap between groups
○ The area of the cirlces doesn’t mean anything, only whether the circles overlap
○ The event A AND B consists of only the outcomes in both event A and event B
○
○ The event A OR B consists of all the outcomes in either event A or event B, or both (we use an inclusive
OR) → careful not to count the BOTH category twice!
find more resources at oneclass.com
find more resources at oneclass.com
Document Summary
A scenario/experiment is random if its outcome cannot be predicted w/ certainty. An event is an outcome or set of outcomes from a random scenario. Coming up with random numbers or assigning people into groups at random is usually not random. If the same scenario always hast he same outcome the scenario = deterministic. Whether it be people or computers, its" difficult to generate randomness. Computers follow an algorithm that generates pseudorandom numbers, starting from the initial number (seed) that generates pseudorandom numbers from it. Seed can be set gives us same (cid:3247)random(cid:3248) results every time. For our purposes, pseudorandom numbers is random enough (not going to be tested) Consider where the randomness is generated from rather than whether it looks random. Probability: numeric way to measure how often random events occur assign a number (proportion or percent) that tells us how frequently we"d expect a random event to occur.