AH 4239 Lecture 9: Inferential Statistics Review and Qualitative Research

Get access


Related Documents

Related Questions
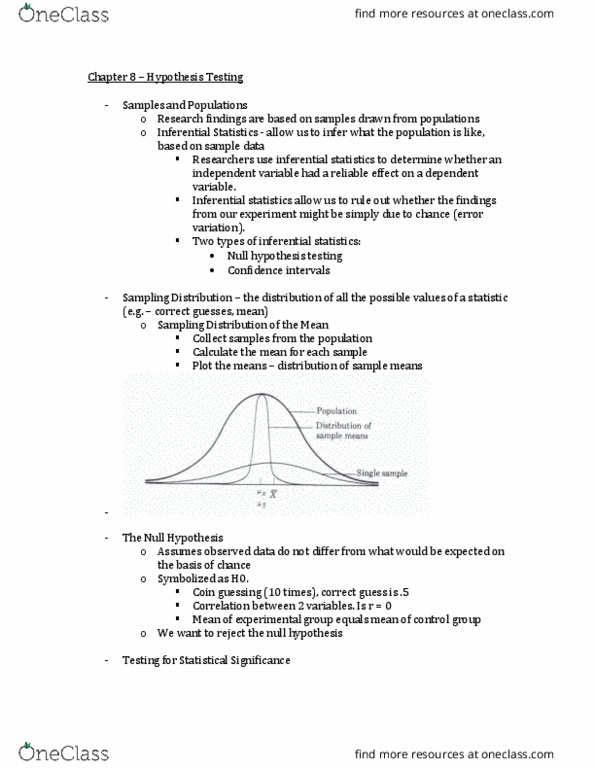
Introduction: A Chi-square test is used to compare observed data with expected data according to a hypothesis. For instance, if you were crossbreeding 2 heterozygous pea plants, you would expect to see a 3:1 phenotypic ratio in the offspring. In this case, if you were to breed 400 pea plants, you would expect to see 300 plants showing the dominant trait and 100 showing the recessive trait. But what happens if you observe only 260 plants with the dominant trait and 140 plants with the recessive trait? Does this mean something is wrong with Mendelian genetics or is this difference in expected results just due to chance (random sampling error)? These are the questions that can be answered using Chi-square statistics. The results of this statistical test is used to either reject or accept (fail to reject) the null hypothesis. The null hypothesis states there is no significant difference between the observed results and the expected results. This means that if the null hypothesis is accepted, the difference in observed and expected results was just a matter of chance and so the observed results basically "fit" with what was expected. Degrees of freedom (df) = number of independent outcomes (Y) being compared less 1 df = Y-1 At the 95% confidence interval we are 95% confident that there is a significant difference between the observed and expected results, therefore rejecting the null hypothesis. Probability Value - Is the decimal value determined from the X2 table and is the probability of accepting the null hypothesis. A 0.05 probability value equates to a 95% confidence interval.
The Chi-squared test formula is: Example: If we cross two pea plants that are heterozygous yellow pods, we would expect a 3:1 phenotypic ratio. So let's say we actually did the cross and got 280 plants with green pods and 120 plants with yellow pods. Question: Is this a 3:1 phenotypic ratio? This is the value of Chi-squared Test. We have a total of 400 plants and we expect a 300 green:100 yellow phenotypic ratio If the calculated Chi-squared value is less than the critical value listed in the Chi-squared table, then we accept the null hypothesis. This means that there is no significant difference between the observed and the expected values. Our degrees of freedom (df) = 2 outcomes - 1, or df = 1. Now we go the X2 table below and using the df = 1 and probability value of 0.05, our critical value is 3.84. Since our calculated X2 value is 5.33, and is larger than the critical value, we reject the null hypothesis and can say (at 95% confidence) that there is a significant difference between our observed and expected values.
The parent generation is yellowed podded and green podded pea plants. You cross a yellow podded pea plant with a green podded pea plant and you get 100% yellow podded plants in the F1 Generation (Phenotypic ratio 4 : 0, yellow to green). What will be the expected phenotypic ratio when you allow the F1 generation to reproduce?
Fill out the Punnett square.
If we actually did the cross and got 1150 yellow and 350 green. Would this be a consistent with what was expected?
Learning Outcomes Questions
1. Why would you run a Chi-squared test?
| To determine if our data is consistent with expected results. | ||
| a To determine if our data is consistent with expected results. b To determine if our data exactly matches the expected results. | ||
| c To determine the expected results. | ||
| d | To compare the phenotypic ratios to the genotypic ratios. |
2. Determine the degrees of Freedom of the phenotypic ratio for this genetic cross.
a. 1
b. 2
c. 3
d. 4
e. 5
3. Using the data given, what is the result of your Chi-squared analysis? x2= ___.
| a. | 2.22 | |
| b | 2.71 | |
| c | 4.36 | |
| d | 187.78 | |
| e | 448.27 |
4. Using the results of your Chi-squared analysis, do we fail to reject or reject the null hypothesis?
| a. | Fail to reject the null | |
| b. | Reject the null | |
| c. | It cannot be determined from the data given |

Chose the correct answers on one through 15(plese help)
1.A research group hypothesizes that successful infection by HIVdepends upon the expression of FSH3, a human gene. They overexpressthis gene in T cells (Which HIV normally infects) so that FSH3protein levels are very high in these cells. In other T-cells, theymutate FSH3 so that none of its encoded protein is made. They thenmeasure HIV infection rate in the control, overexpression, andmutant T cells. The three cultures are otherwise grown in the sameway.
What is the independent variable(s) in this experiment? (Selectall correct answers)
FSH3 protein levels | ||
The medium in which cells are grown | ||
The temperature at which cells are grown | ||
HIV resistance of cells |
Question 2
Which arises from an error in a measurement or observation?
Technical variability | ||
Biological variability | ||
Standard error | ||
Standard deviation |
Question 3
Use the following description of an experiment to answer thenext question.
A research group hypothesizes that successful infection by HIVdepends upon the expression of FSH3, a human gene. They overexpressthis gene in T cells (Which HIV normally infects) so that FSH3protein levels are very high in these cells. In other T-cells, theymutate FSH3 so that none of its encoded protein is made. They thenmeasure HIV infection rate in the control, overexpression, andmutant T cells. The three cultures are otherwise grown in the sameway.
What is the control group(s) in this experiment? (Select allcorrect answers)
The unaltered T cells | ||
The medium in which cells are grown | ||
The T cells in which FSH3 is mutated | ||
The T cells overexpressing FSH3 |
Question 4
How many of the following statements are true?
I. All papers have an abstract, methods, results, and discussionsection
II. The methods always follows the introduction
0 | ||
2 | ||
1 |
Question 5
If scientific convention states that when a P value of less than0.05 is considered significant (in other words, the two groupsbeing measured are actually different), this means that: (Selectall correct answers)
If you were to repeat the experiment 100 times, there would notbe a significant difference between the groups in 5 of theexperiments | ||
95% of all conclusions that state two groups are not differentbased on a 0.5% p-value threshold are false negatives | ||
The groups are actually not different from each other 95% of thetime | ||
5% of all conclusions that state two groups are different basedon a 0.5% p-value threshold are false positives |
What information is typically found in the introduction sectionof a paper? (Select all that apply)
The dependent and independent variables within the study | ||
Which areas of the field are not well understood and whatquestion the study addresses | ||
How the main question of the paper is related to other researchin the field. | ||
How previous work forms the basis for the current study | ||
The purpose of the study | ||
Details of the approaches used | ||
A summary of relevant related studies |
Question 7
How can you judge for yourself whether the conclusions reachedin a paper are valid? (Select all that apply)
Read papers of other authors studying the same question or areaof inquiry | ||
Determine if each hypothesis is supported by different types ofevidence/approaches. | ||
Consider closely whether the data actually both addresses andsupports the authorâs hypothesis. | ||
Examine the amount of data in the paper, and how long the paperis. | ||
Whether the authors find a mechanism, or exactly how on variableaffects another. | ||
Interpret the data for yourself without looking the discussion,then compare your interpretations to that of the authorâs. |
Question 8
Where can you usually find the institutional affiliations (wherethey work) of the authors?
Within the discussion | ||
In the acknowledgements section | ||
Below the authors list | ||
This is not usually included in papers |
Question 9
Other than publishing primary research articles, what is themain way scientists disseminate their results?
Lab meetings | ||
Personal correspondence | ||
Conference seminars | ||
Public lectures |
Question 10
Use the following description of an experiment to answer thenext question.
A research group hypothesizes that successful infection by HIVdepends upon the expression of FSH3, a human gene. They overexpressthis gene in T cells (Which HIV normally infects) so that FSH3protein levels are very high in these cells. In other T-cells, theymutate FSH3 so that none of its encoded protein is made. They thenmeasure HIV infection rate in the control, overexpression, andmutant T cells. The three cultures are otherwise grown in the sameway.
What is the experimental group(s) in this experiment? (Selectall correct answers)
Each group is its own control | ||
The T cells overexpressing FSH3 | ||
The T cells in which FSH3 is mutated | ||
The unaltered T cells |
