MARK 4000 Lecture 11: Lecture 11

8 Mar 2018
School
Department
Course
Professor
Document Summary
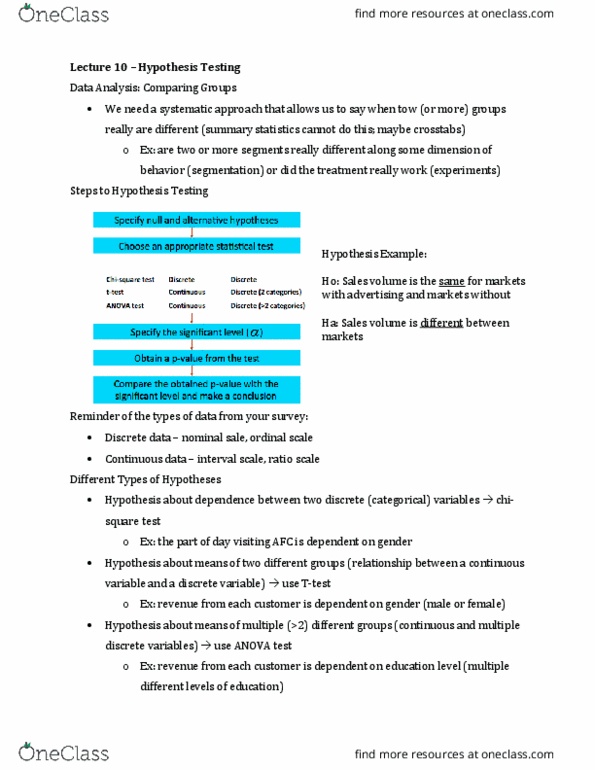
Correlation analysis: a statistical technique used to measure the linear relationship between two or more variables (r is between -1 and 1, look at slides for excel process. If p-value is less than 5%, both variables are significant, reject null: there is a significantly positive relationship between rev and visits, prediction, get a formula from the regression results: revenue = b0 + b1*visits. Increase visits by 1 time: before: b0 + b1*v, after: b0 + b1*(v+1, after before = associated revenue change.