STC 262 Study Guide - Midterm Guide: Statistical Parameter, Statistical Hypothesis Testing, Ingroups And Outgroups

28 Jun 2018
School
Department
Course
Professor

Com 262 – Exam II – Study Guide
CHAPTER 12 – Experimental Designs
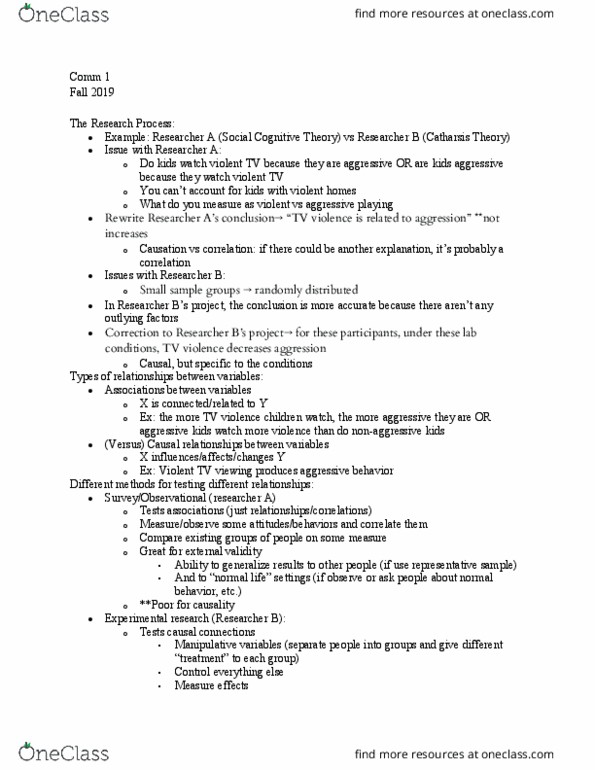
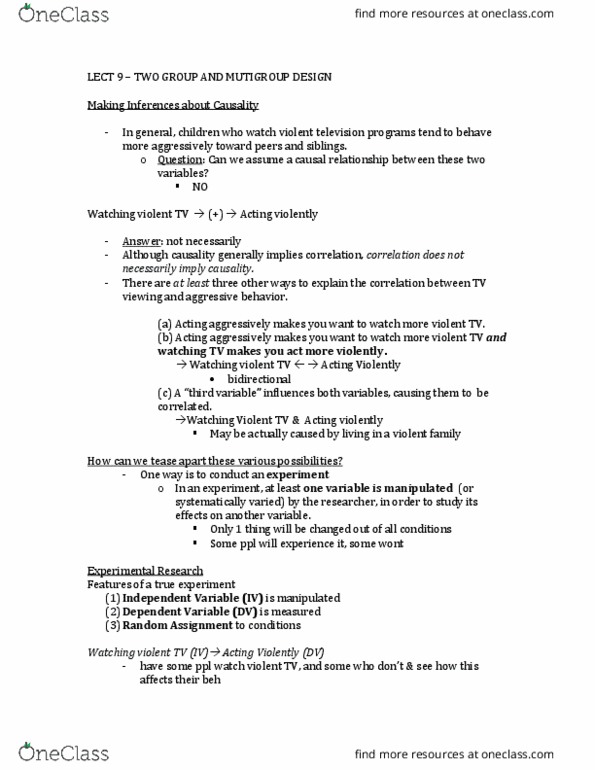
• Experimental Design: helps us establish causation, cause and effect
o Ex. violent TV makes kids violent
o X: violent TV → leads to Y: outcome (violence)
o Problem: other factors contribute to violence, besides TV such as family,
environment → those must also be measured
o Researcher can manipulate how much TV is watched and then measure violence
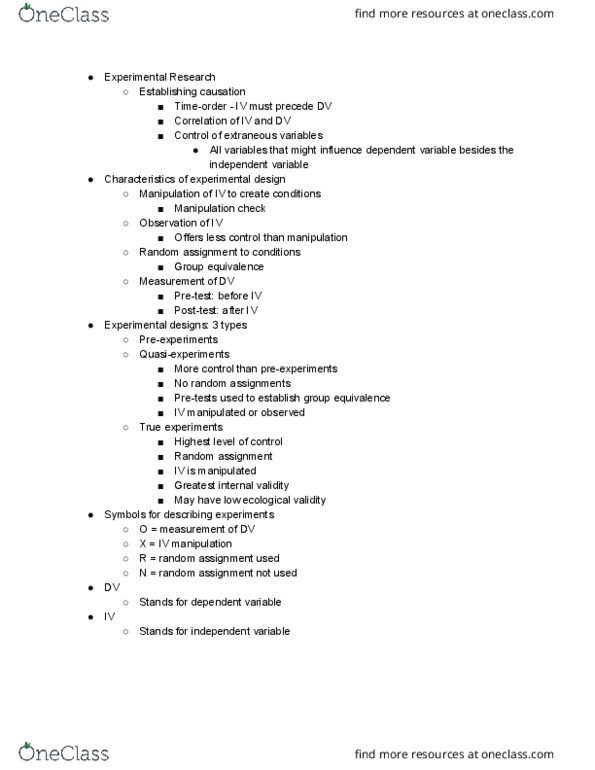
• Characteristics of experimental design:
o Manipulation of IV
o Random assignment of participants into conditions
• Criteria for establishing Causation:
1. X precedes Y in time
a. IV must precede the DV in time
b. Violence and TV watched, both increased
2. Changes in the DV are due to the IV
a. Amount of violence is due to the amount of TV watched
3. Have to be theoretically related, the IV and DV must covary with each other
• Random Assignment vs. Random Selection
o Random Selection (RS) is sample
o Random Assignment (R) are levels of playing field before starting the experiment, key
in experimental design, randomly placing people into one of your three conditions,
ensures representativeness
▪ Aspects researcher must look at while doing research
• R, manipulation of IV, measurement of DV and control
▪ How you place participants into conditions
▪ Ex. if you’re testing for violence and have people who are not violent, don’t put
them in a low watching TV group → skews the results because it would keep
them at not violent
▪ Want to make the two groups as similar as possible
• Experimental Notations (symbols)
o R = random assignment (true experiment)
o X = experiment/variable treatment
o O = observation of the DV
• Types of experimental design
1. Pre/Descriptive
a. One-shot case study- missing base line and no compare group (weak)
i. Treatment → post-test
find more resources at oneclass.com
find more resources at oneclass.com

ii. X → O (did something then measure them)
iii. Problem is that the treatment may have nothing to do with the results
from the post-test – no comparison/control group
b. One-group pre-test – post-test design (Dependant testing) AKA before-after
design
i. O1 X O2
ii. Pre-test – experiment/treatment – post-test
iii. Now we have baseline information because we know where you started
c. Post-test only non equivalent group design (static group comparison)
i. nX1 → O1 and O2
ii. Ex. compare class A to class B
iii. Class A has taken COM 262, while class B has not taken 262
iv. Group comparison
2. Quasi – Experimental Design
a. Pre-test/post-test Quasi-Equivalent Design
i. Time1 Time2
ii. Experimental group 1: O1 X O3 → Compare T1 and T2. T2 should
be higher
iii. Control group 2: O2 O4 → should stay the same because
it hasn’t been exposed to anything
iv. O1, O2 should be equivalent/ similar when we start and O3, O4 should
be different after the experiment
b. Single group interrupted time – series design
i. T1 T2 T3 T4 T5 T6
ii. O1 → O2 → O3 → X → O4 → O5 → O6
iii. Ex. you don’t see a change in 1,2,3. Then you have your experiment/
treatment and if you don’t see a change at T4, don’t panic → as you may
talk to others, think about it and then see changes in T5, T6
c. Interrupted time series design (multiple time series)- has a control group
i. T1 T2 T3 T4 T5 T6
ii. O1 → O3 → O5 → X → O7 → O9 → O11 (exp. grp)
iii. O2 → O4 → O6 → → O8 → O10 → O12 (control g)
iv. Expect change in 7,9,11 and NO change in 8,10,12 because they didn’t
get an experiment/treatment
3. True Experimental design (now have R→ Random Assignment)
a. Two-Group, post-test only, equivalent group design
i. NO pre-test measure
ii. R X O1
iii. R O2
iv. Compare O1 to O2
find more resources at oneclass.com
find more resources at oneclass.com

b. Pre-test, Post-test, equivalent group design
i. RO1 X O3
ii. RO2 O4
iii. 1 and 2 should be the same and see change in 1 and 3
iv. 2 and 4 should have NO change → because there is no experiment
v. Should see a difference in 3 and 4
c. Solomon four group design- assume its random, allows us to most threats to
validity
i. T1 T2
ii. grp.1/exp.1 R O1 X O3
iii. grp.2/crtl.1 R O2 O4
iv. grp.3/exp.2 R X O5
v. grp.4/crtl.2 R O6
vi. * Helps us address most threats to validity
- Confederate: individuals who pretend to be researchers or research participants but are
really part of the experimental manipulation, you don’t know that till after the survey
- Factorial Designs: experimental designs that include more than one IV
o The categories of each factor are called levels/factors
o Different level of variables/factors are examined
o The numbers used to represent the design refer to the levels in EACH on of the IV’s
o IV1 IV2
o 2X2 → both IVs are made up of 2 groups
o 2X2 = 4 cells
o Ex. IV1 = sex (M/F)
o IV2 = height (S/T)
o DV = attraction
- Draw in fact. Design chart:
- Once you have significant interaction effect, you can’t interpret manufacts (aka, once
combined you can’t look at the variables separately)
find more resources at oneclass.com
find more resources at oneclass.com
Document Summary
Com 262 exam ii study guide. T2: t1, o1 o2 o3 x o4 o5 o6, ex. you don"t see a change in 1,2,3. Confederate: individuals who pretend to be researchers or research participants but are really part of the experimental manipulation, you don"t know that till after the survey. Iv1 = sex (m/f: iv2 = height (s/t, dv = attraction. Mixing paint: if numbers are different, 3,4,5,3 then there is an interaction, if you have an interaction (#"s are diff. ) you can separate iv"s and look at affects separately. 2x2x4 = 3 iv"s, and 16 cells: 3-way interaction equals all 3 iv"s have an effect on the dv, if no interaction, go to a 2-way interaction (then main effect) Population- entire set of objects, observations or scores that have some common characteristic. Sample- people or units that researchers actually include in the study: population= 16,000 students, sample= 200 students. Generalizability/ representation: the more representative, the more generalizable: ex.