ECO 182 Study Guide - Midterm Guide: Marginal Utility, Economic Equilibrium, Demand Curve

25 May 2018
School
Department
Course
Professor

ECO 182 study guide for test two
Chapter 8: Utility and Demand
❖ Factors that influence the choices you make as a buyer
➢ Consumption possibilities
▪ All things a consumer can afford to buy, limited by
income and price
▪ Budget line- shows the limits of consumption
possibilities (constraints on consumption choices)
• Any point along or inside (under) the line is
affordable
➢ Preferences
▪ A person’s likes or dislikes
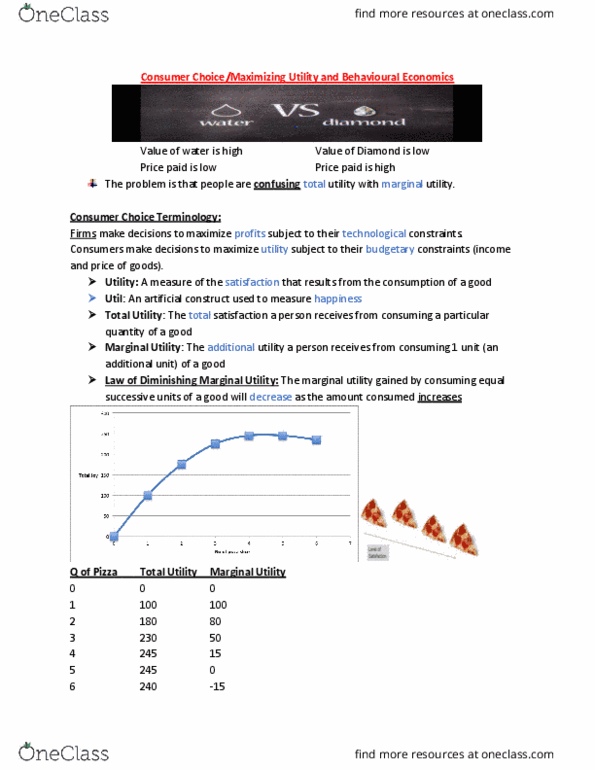
▪ Utility- benefit or satisfaction of consuming
▪ Total utility- total benefit a person gets from
consuming (more consumption, more total utility)
▪ Marginal utility- change in total utility that results
in a unit increase in the quantity of the good
consumed (more quantity consumed, less
marginal utility)
• Paradox of value states why water is cheaper
than diamonds
Water is elastic because we need it, has
low price (small MU, large TU)
Diamonds are inelastic and luxury good,
has high price (large MU, small TU)
▪ Diminishing marginal utility- principle that a decrease in marginal utility as the
quantity of the good increases
• Ex. Each cup of coffee consumed has less satisfaction after a certain point
▪ Consumer equilibrium- situation in which all available income maximizes total
marginal utility (highest form of total utility from both goods when added together)
• When looking at a chart, focus on the total utility from good A and good B and
see if the number below it is lower than the one before- the highest one is the
consumer equilibrium
➢ Choosing at the margin
▪ Marginal utility- increase in utility results from consuming one more good
▪ Marginal utility per dollar- marginal utility of a good that results in spending more
dollar on it (marginal utility per dollar=marginal utility/price)
▪ Utility maximizing rule- consumer’s total utility maximized by:
• Spend all available income (shift right on demand curve)
• Equalize marginal utility per dollar for all goods (shift left on demand curve there
is a price increase)
➢ Think of utility like temperature- abstract and know if we are feeling something
➢ When we feel good about a purchase when we get what we pay for

Chapter 9: Possibilities, preferences, and choices
❖ Budget line- describes the limits to the household’s consumption choices
➢ Similar to PPF because it can be along or below efficiency
➢ Combinations of preferences
➢ Constraint on consumption choices (only can afford or below the budget line)
❖ Budget equation (describes the budget line)
➢ Expenditure= income
➢ PsQs+PmQm=Y
▪ P is price
▪ Q is quantity
▪ S is good A
▪ M is good B
▪ Y is income/budget
➢ Unrealistic because of savings/cushion for unforeseen circumstances (the jar from UP)
➢ Qs=Y/Ps – (Pm/Ps)Qm
▪ Y/Ps is the real outcome in terms of soda/ good A
▪ Pm/Ps is the relative price of a movie in terms of soda /good B in terms of good A
❖ Real income- quantity of goods a household can buy
❖ Relative price- portion of the price passed on the price of one
good divided by the price of another (reflects the slope of the
line)
➢ Think of it as opportunity cost
❖ Change in income
➢ Change in money brings a parallel shift of the budget line
➢ Slope doesn’t change because price doesn’t change
➢ Ability to purchase changes
❖ Indifference curve- line that shows combinations of goods among a consumer that are
indifferent/ ok with
➢ Any point above the indifference curve is preferred
➢ More is better
➢ Preference map- series of indifferent curves
▪ Shift right is more preferable
❖ Marginal rate of substitution (MRS)- measures the rate at
which a person is willing to give up good Y to get an
additional unit of good X while at the same time remaining
indifferent
➢ Measured by the slope of the indifference curve
➢ Steep- high MRS (give up large quantity of Y for a bit
more of X)
➢ Flat- low MRS (give up small quantity of Y for more X)
❖ Diminishing marginal rate of substitution- tendency for a person to give up less of good Y to
get more of good X while remaining indifferent as the quantity of good X increases
➢ The price to replace one good with another is less as you move down the indifference
curve

➢ MRS at C is 2 while MRS at G is ½
➢ Explains why the curve is shaped the way it is
❖ Best affordable choice
➢ On budget line
➢ Highest attainable indifference curve
➢ MRS=Relative price
❖ Price effect- the effect of a change in the price of a good has on the
quantity consumed (budget line moves)
➢ Ex. If the price of a movie ticket falls, the budget line moves
outward and the shift right makes a higher indifference curve
▪ Benefits the consumer to consumer a greater degree
▪ Able to buy more goods as the price of one good, like movie
tickets, goes down and the consumer is able to buy more as
the budget line shifts right (able to afford more)
❖ Income effect- effects of a change in income on buying plans
➢ As income decreases, the budget line shifts left/inwards
because they are unable to buy what they used to
➢ As income increases, the budget line shifts right/outwards as they are able to buy more
than previously
➢ Look at change of income graph to see effects
❖ Substitution and income effect
➢ For a normal good- fall in price, more consumed
➢ Price effect- shift right when price of goods fall
➢ Substitution effect- effect of a change in price has on the quantity bought when the
consumer remains on the same indifference curve and moves downwards alongside it
(relative price matters)
➢ Income effect- moves the indifference curve and reinforces the substitution effect
(slopes downwards)
➢ Interior goods decrease as income increases (works against substitution effect)
Chapter 10: Organizing production
❖ Firm- institution that hires factors of production and organizes them to produce and sell
goods and services
➢ Goal is maximize profits
➢ If not, then it can be eliminated or taken over by a more
profitable firm
❖ Accounting profit
➢ Ensures that the firm pays the correct amount of tax and
to show how funds are being used to investors
➢ Profit= total revenue- total cost
➢ Calculate the firm’s depreciation cost
❖ Economic accounting
➢ Economist measure to predict the firm’s decisions and the goal of the of these decisions
to maximize economic profit
Document Summary
Factors that influence the choices you make as a buyer. Consumption possibilities: all things a consumer can afford to buy, limited by income and price, budget line- shows the limits of consumption possibilities (constraints on consumption choices, any point along or inside (under) the line is affordable. Water is elastic because we need it, has low price (small mu, large tu) Diamonds are inelastic and luxury good, has high price (large mu, small tu: diminishing marginal utility- principle that a decrease in marginal utility as the quantity of the good increases, ex. Think of utility like temperature- abstract and know if we are feeling something. When we feel good about a purchase when we get what we pay for. Budget line- des(cid:272)(cid:396)i(cid:271)es the li(cid:373)its to the household"s (cid:272)o(cid:374)su(cid:373)ptio(cid:374) (cid:272)hoi(cid:272)es. Similar to ppf because it can be along or below efficiency. Constraint on consumption choices (only can afford or below the budget line)