STAT1008 Chapter Notes - Chapter 5: Normal Distribution, Standard Deviation, Central Limit Theorem

Document Summary
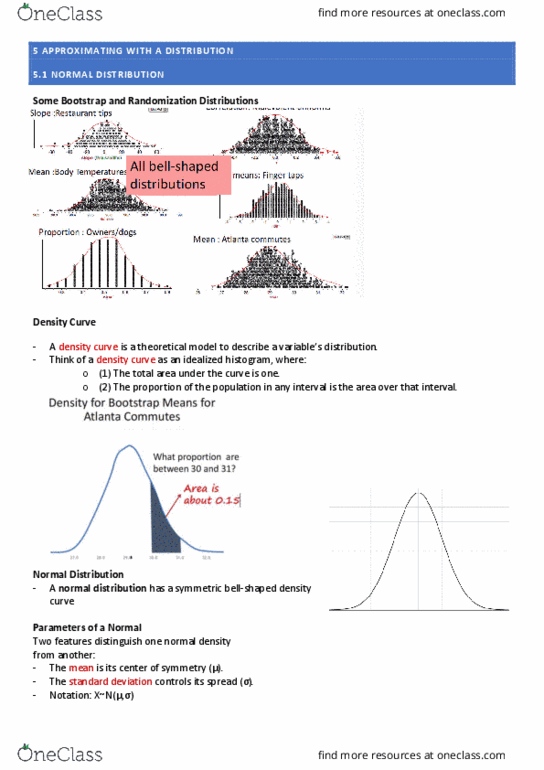
A density curve is a theoretical model to describe a variable"s distribution. Think of a density curve as an idealised histogram, where: the total area under the curve is one and the proportion of the population in any interval is the area over that interval. Two features distinguish one normal density from another: The mean is its centre of symmetry . = 0, =1 -> z n(0,1) To convert any x n ( , ) If we can approximate a bootstrap distribution with a normal construct a con dence interval. If we can approximate a randomisation distribution with a normal compute a p-value. For random samples with a suf ciently large sample size, the distribution of sample statistics for a mean or a proportion is normally distributed. The central limit theorem holds for any original distribution, although suf ciently large sample size varies.