FNCE10001 Chapter Notes - Chapter 10: Market Risk, Standard Deviation, Expected Return

25 May 2018
School
Department
Course
Professor

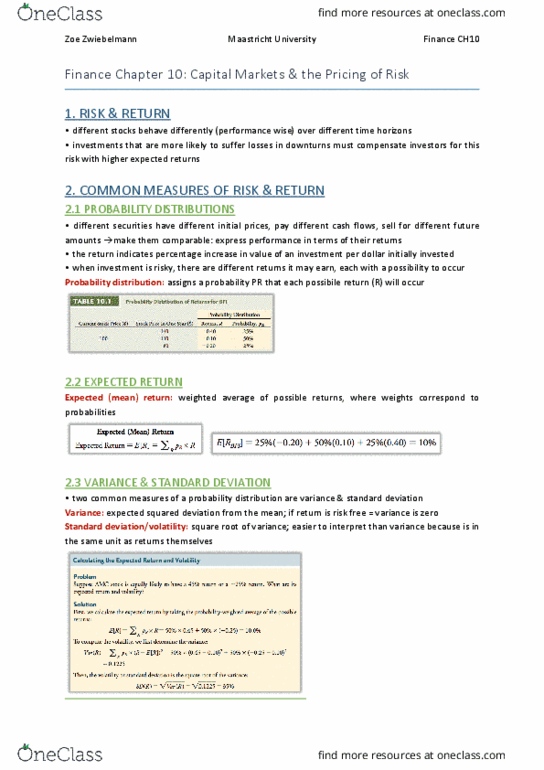
Summarises likelihood of each possible return occurring
-
Assigns probability, p
R
, that each possible return, R, will occur
-
Probability distributions:
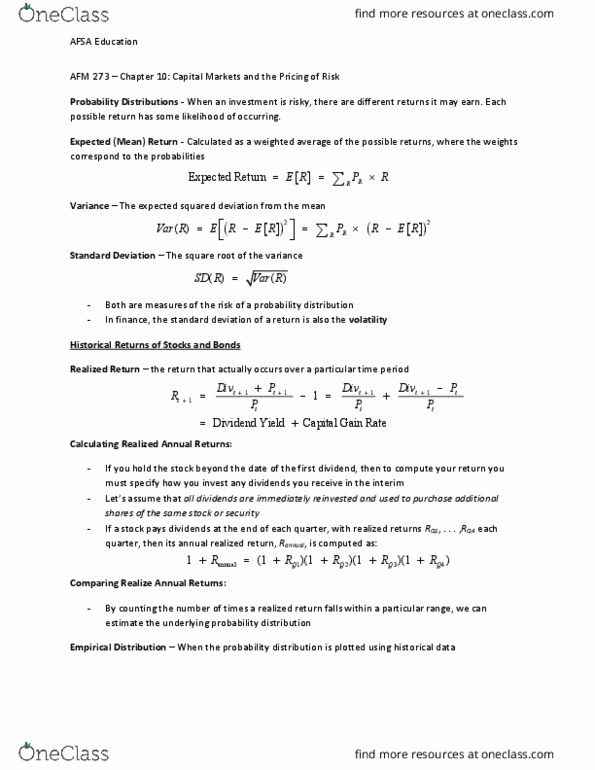
Expected (mean) return = weighted average of possible returns
-
Expected return = sum of all R (p
R
x R)
-
Expected return:
Variance = deviation of distribution from the mean = expected squared deviation from the
mean
-
Standard deviation = square root of variance
-
Volatility = standard deviation of a return
-
Variance and standard deviation:
Explicit probability distributions are usually unknown so extrapolate from historical data if
environment is stable and distribution of future returns should mirror that of past returns
Common Measure of Risk and Return
Friday, 31 March 2017 6:52 PM
Principles of Finance Page 1

Realised return = return that actually occurs over a particular time period
-
Computing historical returns:
Assume dividends are reinvested immediately and used to purchase additional shares of the
same stock/security
-
Both dividends and capital gains contribute to total realised return
-
Returns are risky
-
Calculating realised annual returns:
Over a particular period only one draw from the probability distribution of returns is observed
-
If probability distribution remains the same, multiple draws can be observed
-
Counting number of times realised return falls within a particular range, underlying probability
distribution can be estimated
-
Comparing realised annual returns
Empirical distribution = plotted probability distribution
Average annual return = average of realised returns
-
Balancing point of the empirical distribution
-
Average annual returns:
Standard deviation can be estimated to quantify difference in variability
-
Variance and volatility of returns:
To estimate cost of capital for investment, expected return investors require as compensation
for risk needs to be determined
-
If distribution of past returns and future returns are the same, look at return investors
expected to earn in the past on same/similar investments and assume they will require same
return in the future
-
Do not know what investors expected in the past; can only observe actual realised
returns
○
Average return is an estimate of true expected return and is subject to estimation error
○
Two difficulties with this approach
-
Estimation error: using past returns to predict the future
Indicates how far sample average might deviate from expected return
-
If distribution of stock's return is identical each year and each year's return is independent of
prior years' returns, SD (average of independent, identical risk) = SD (individual risk) / sqrt(no.
of observations)
-
Standard error = standard deviation of estimated value of mean of actual distribution around its true
value = standard deviation of average return
95% confidence interval = historical average return +
-
(2 x standard error)
-
95% confidence interval:
Individual stocks are more volatile than large portfolios and have usually been in existence for
fewer years so there is little data to estimate returns with
-
Relatively large estimation error
-
Limitations of expected return estimates:
Historical Returns of Stocks and Bonds
Friday, 31 March 2017 9:33 PM
Principles of Finance Page 2
Document Summary
Assigns probability, pr, that each possible return, r, will occur. Expected (mean) return = weighted average of possible returns. Expected return = sum of all r (pr x r) Variance = deviation of distribution from the mean = expected squared deviation from the mean. Explicit probability distributions are usually unknown so extrapolate from historical data if environment is stable and distribution of future returns should mirror that of past returns. Realised return = return that actually occurs over a particular time period. Assume dividends are reinvested immediately and used to purchase additional shares of the same stock/security. Both dividends and capital gains contribute to total realised return. Over a particular period only one draw from the probability distribution of returns is observed. If probability distribution remains the same, multiple draws can be observed. Counting number of times realised return falls within a particular range, underlying probability distribution can be estimated. Average annual return = average of realised returns.