BUS400 Chapter Notes - Chapter 3: Scatter Plot, Demand Curve, Inferior Good

Document Summary
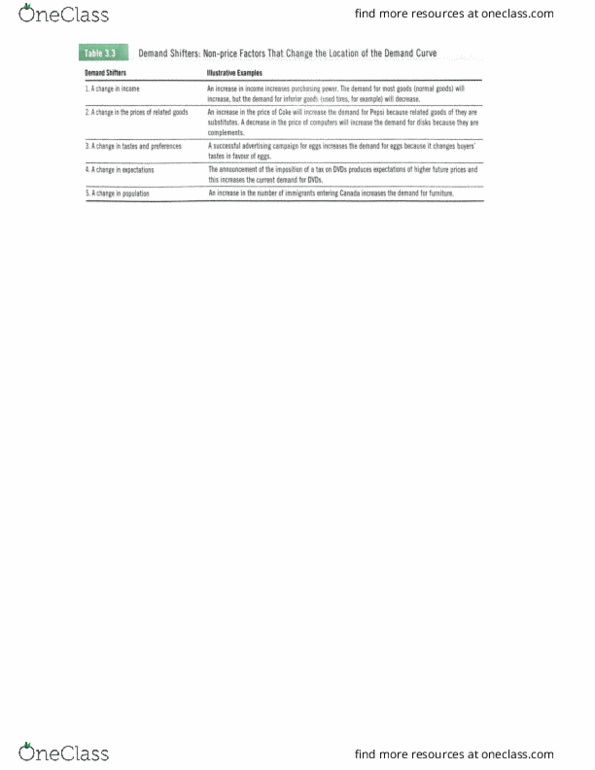
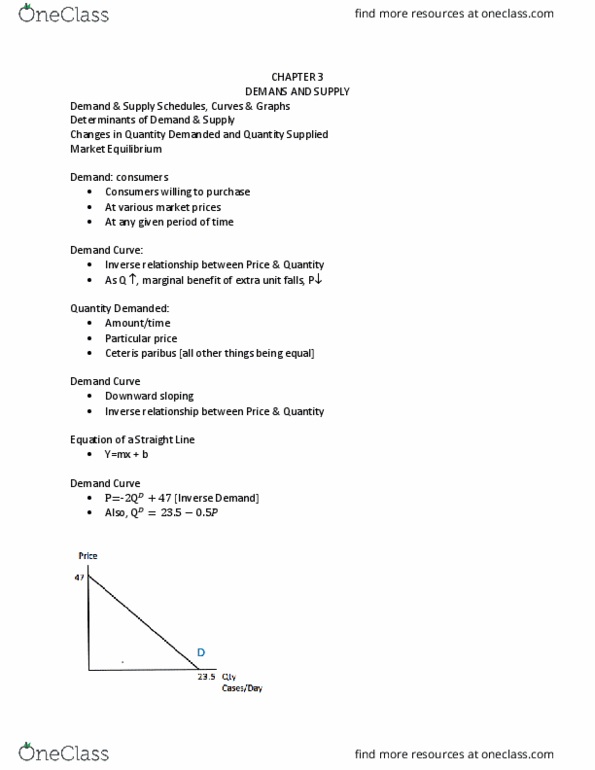
Demand, supply and prices: basic concepts: define demand. A table showing the inverse relationship between price and quantity. A demand schedule plotted on a scatter plot. A change in the prices of related goods. A change in population: distinguish between each pair of terms: substitute and complement, normal and inferior good. A substitute goods are goods that can replace another good (like lemon for lime). Compliments are goods that can be used together (automobiles and fuel). A normal goods are ones for which the demand increases as consumers" income increases. And inferior goods are ones for which demand decreases as income increases (kraft dinner): distinguish between a change in demand and a change in quantity demanded. A change in demand would be a movement of the entire demand curve, this is only caused by a change in a non-price determinant.