GEOG187 Chapter Notes - Chapter 6: Map Algebra, Floating Point, Electric Field

10 Oct 2016
School
Department
Course
Professor
Document Summary
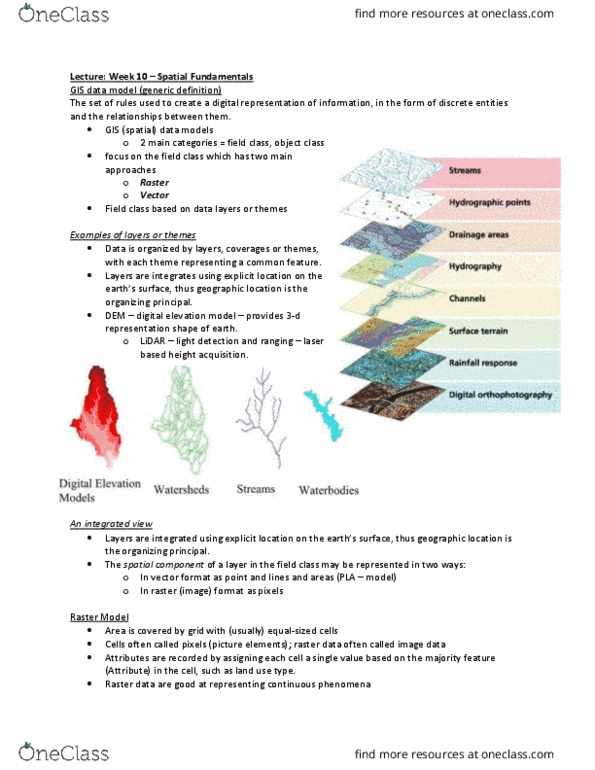
2 fundamental ways that geographic data can be represented in gis: discrete objects (vector data) Viewed as single data points within an empty world: continuous fields (raster data) Measurea(cid:271)le at a(cid:374)(cid:455) poi(cid:374)t o(cid:374) earth(cid:859)s surfa(cid:272)e, (cid:272)ha(cid:374)gi(cid:374)g (cid:448)alue/(cid:373)ag(cid:374)itude fro(cid:373) (cid:272)ell to (cid:272)ell. Data divided into array of rectangular (square) cells/pixels of the same size. Cell values hold attribute information related to the geographic variable it represents through coding schemes: categories (land use) 1 or 0: floating point (elevation) Grid is defi(cid:374)ed (cid:271)(cid:455) e(cid:454)te(cid:374)t, spa(cid:272)i(cid:374)g a(cid:374)d (cid:862)(cid:374)odata(cid:863) i(cid:374)for(cid:373)atio(cid:374: # of rows and columns, cell sizes (x and y, top left and bottom right coordinates. Vector representation as raster: points, polyline, polygons. Level of detail is relative to spatial resolution of sensor or data creation method. Different satellites and sensors have different resolutions: raster generalization. Largest share rule: takes a given cell and if 50% is covered with land then (cid:449)hole (cid:272)ell is la(cid:374)d, if (cid:374)ot the(cid:374) it(cid:859)s (cid:449)ater.