ACCT 2000 Chapter : Accnt2000 Ch 2 Class Notes Word
13 views14 pages

Document Summary
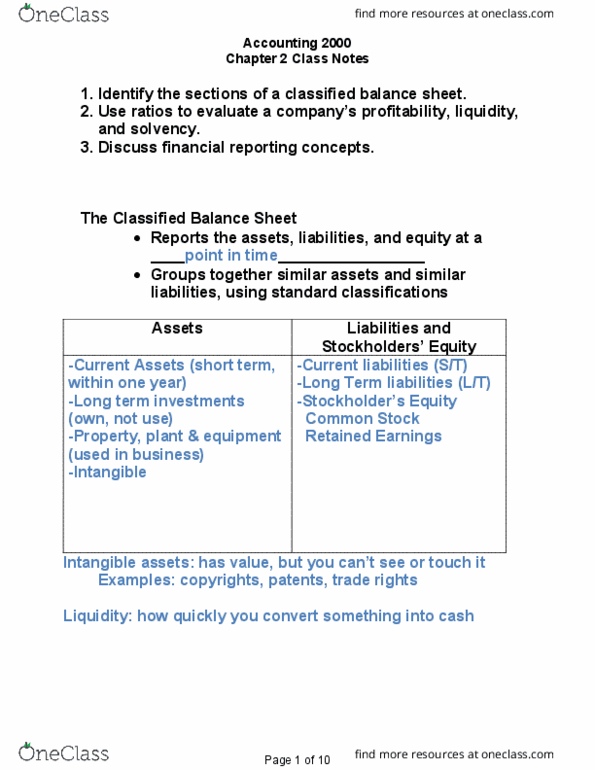
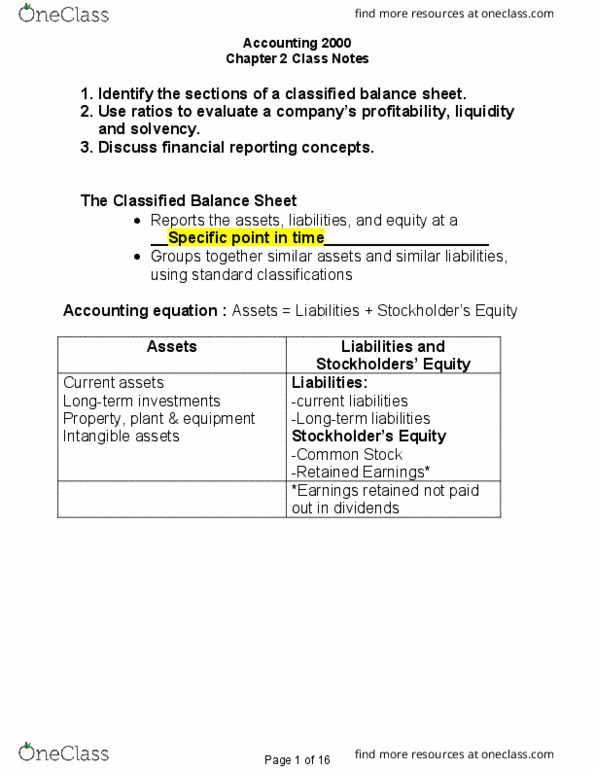
Chapter 2 class notes: identify the sections of a classified balance sheet, use ratios to evaluate a company"s profitability, liquidity and solvency, discuss financial reporting concepts. Reports the assets, liabilities, and equity at a specific point in time. Groups together similar assets and similar liabilities, using standard classifications. Stockholders" equity: current assets-what we use up or convert to cash.
Get access
Grade+
$40 USD/m
Billed monthly

Homework Help
Study Guides
Textbook Solutions
Class Notes
Textbook Notes
Booster Class
10 Verified Answers
Class+
$30 USD/m
Billed monthly

Homework Help
Study Guides
Textbook Solutions
Class Notes
Textbook Notes
Booster Class
7 Verified Answers
Related Documents

Related Questions
| Oceanview MarineCompany 1-1 | |||||
| Balance Sheet | |||||
| 31-Dec-15 | |||||
| Assets | 2015 | 2014 | 2013 | ||
| Current Assts | |||||
| Cash | $ 1,320,096 | $ 1,089,978 | $ 1,200,347 | ||
| AccountsReceivable: Notes 2 and 5 | $ 1,646,046 | $ 1,285,593 | $ 1,180,982 | ||
| Inventories *Notes 1a, 3, and 5 | $ 13,524,349 | $ 12,356,400 | $ 11,461,231 | ||
| PrepaidExpenses | $ 17,720 | $ 15,826 | $ 15,275 | ||
| Deposits | $ 7,916 | $ 5,484 | $ 4,329 | ||
| Total CurrentAssets | $ 16,516,127 | $ 14,753,281 | $ 13,862,164 | ||
| Property, Plant, Equipment *Notes 1b and 4 | |||||
| at cost, less accumulated depreciation | $ 596,517 | $ 612,480 | $ 627,771 | ||
| TOTAL ASSETS | $ 17,112,644 | $ 15,365,761 | $ 14,489,935 | ||
| LIABILITIES | |||||
| CurrentLiabilites | |||||
| Note Payable -Bank * Note 5 | $ 5,100,000 | $ 4,250,000 | $ 4,000,000 | ||
| Accountspayable | $ 1,750,831 | $ 1,403,247 | $ 1,106,574 | ||
| AccruedLiabilities | $ 257,800 | $ 217,003 | $ 211,250 | ||
| Federal IncomeTax Payable | $ 35,284 | $ 45,990 | $ 39,725 | ||
| Current portionof long-term debt | $ 5,642 | $ 5,642 | $ 5,642 | ||
| TotalCurrent Liabilities | $ 7,149,557 | $ 5,921,882 | $ 5,363,191 | ||
| Long-Term Liabilities | |||||
| Long-TermDebt | $ 409,824 | $ 415,466 | $ 421,108 | ||
| TOTAL LIABILITIES | $ 7,559,381 | $ 6,337,348 | $ 5,784,299 | ||
| STOCKHOLDERS EQUITY | |||||
| Common Stock - * Note 7 | $ 10,000 | $ 10,000 | $ 10,000 | ||
| Additional paid in capital | $ 2,500,000 | $ 2,500,000 | $ 2,500,000 | ||
| Retaind Earnings | $ 7,043,263 | $ 6,518,413 | $ 6,195,636 | ||
| Total Stockholder Equity | $ 9,553,263 | $ 9,028,413 | $ 8,705,636 | ||
| TOTAL LIABILITIES AND STOCKHOLDEREQUITY | $ 17,112,644 | $ 15,365,761 | $ 14,489,935 | ||
| Liquidity ratios: | unadjusted 12/31/2015 | unadjusted 12/31/2014 | CHANGE | Percent Change | Industry Average |
| CurrentRation | 2.31 | 2.49 | -0.18 | -7.23% | 1.53 |
| Quick Ratio | 0.42 | 0.4 | 0.02 | 5.00% | 0.43 |
| Sales/ReceivableRatio | 16.05 | 17.78 | -1.73 | -9.73% | 20.29 |
| Number of dayssales in A/R | ? | ? | ? | ? | 17.99 |
| InventoryTurnover | ? | ? | ? | ? | 1.41 |
| PROFITABILITY/PERFORMANCE RATIOS: | |||||
| Gross Profit Margin (%) | ? | ? | ? | ? | 39.83% |
| Income before taxes / owners' equity | ? | ? | ? | ? | 0.06 |
| Income before taxes / total assets | 0.06 | 0.04 | 0.02 | 50.00% | 0.04 |
| Sales / Long - term assets | 44.29 | 37.33 | 6.96 | 18.64% | 19.07 |
| Sales / Total Assets | 1.54 | 1.49 | 0.05 | 3.36% | 1.32 |
| Sales / Working Capital | 2.82 | 2.59 | 0.23 | 8.88% | 2.18 |
| SOLVENCY RATIOS | |||||
| Owners Equity / Total Assets | 0.56 | 0.59 | -0.03 | -5.08% | 0.31 |
| Long - Term Assets / owners' Equity | 0.06 | 0.07 | -0.01 | -14.29% | 0.47 |
| Current Liabilities / Owners Equity | ? | ? | ? | ? | 1.13 |
| Total Liabilities / Owners Equity | ? | ? | ? | ? | 2.03 |
| Please answer the questionmarks and show computation | |||||

Write an assessment of the company's financial performance,using ratios to support your conclusion. What can you concludeabout the company's liquidity, solvency, and profitability? Be sureto include the ratios calculation to support your conclusion.
Use the financial statements provided below to calculate thefollowing financial ratios:
| 2012 | 2011 | |
| 1. Current Ratio | 10.915 | 6.715 |
| 2. Quick Ratio | 11.307 | 7.524 |
| 3. Long-Term Debt-to-Equity Ratio | 2.785 | 3.834 |
| 4. Debt-to-Equity Ratio | 2.785 | 3.834 |
| 5. Long-Term Debt Ratio | 2.866 | 3.988 |
| 6. Accounts Receivable Turnover Ratio (Assume that60% of Sales are Credit | 25.491 | 8.908 |
| 7. Inventory Turnover Ratio (Assume 2011 beginninginventory was -0-.) | -0.715 | -0.450 |
| 8. Asset Turnover Ratio | 0.163 | 0.076 |
| 9. Gross Profit Percentage | 0.731 | 0.806 |
| 10. Net Profit Margin Percentage | 0.375 | 0.311 |
| 11. Return on Assets | 0.061 | 0.024 |
| 12. Return on Equity | 0.237 | 0.118 |
Get Your Motor Runnin'
Compartive Balance Sheets
| 2012 | 2011 | |
| Assets | ||
| Current Assets | ||
| Cash | $198,456 | $147,333 |
| Accounts Receivable | 4,000 | 5,000 |
| Allowance for Uncollectible Accounts | (250) | 80 |
| Supplies | 200 | 250 |
| Inventory | 35,000 | 32,000 |
| Total current assets | 237,406 | 184,663 |
| Property, Plant, and Equipment | ||
| Equipment | 60,000 | 15,000 |
| Accumulated Depreciation - Equipment | (14,000) | (1,000) |
| Vehicles | 35,000 | 35,000 |
| Accumulated Depreciation - Vehicles | (4,800) | (2,400) |
| Building | 684,375 | 684,375 |
| Accumulated Depreciation - Building | (25,000) | (12,500) |
| Land | 46,875 | 46,875 |
| Land Improvements | 23,750 | 23,750 |
| Accumulated Depreciation - Land Improvements | (2,539) | (663) |
| Total PP&E | 803,661 | 788,437 |
| Total Assets | $1,041,067 | $973,100 |
| Liabilities and Stockholders' Equity | ||
| Current Liabilities | ||
| Accounts Payable | $20,000 | $24,000 |
| Wages Payable | 1,000 | 500 |
| Warranties Payable | 750 | 500 |
| Notes Payable | 0 | 2,500 |
| Total current liabilities | 21,750 | 27,500 |
| Long-term Liabilities | ||
| Bonds Payable | 750,000 | 450,000 |
| Mortgage Payable | 0 | 300,000 |
| Total long-term liabilities | 750,00 | 750,000 |
| Total liabilities | 771,750 | 777,500 |
| Stockholder's Equity | ||
| Common Stock | 125,000 | 125,000 |
| Paid-in capital in excess of par - common | 25,000 | 25,000 |
| Preferred Stock | 40,000 | 20,000 |
| Paid-in capital in excess of par - preferred | 25,000 | 15,000 |
| Less: Treasury Stock | (3,000) | (3,000) |
| Paid-in capital - treasury stock | 500 | 500 |
| Retained Earnings | 56,817 | 13,100 |
| Total stockholders' equity | 269,317 | 195,600 |
| Total liabilities and stockholders' equity | $1,041,067 | $973,100 |
Get Your Motor Runnin'
Comparative Income Statements
| 2012 | 2011 | |
| Service Revenue | $93,693 | $50,230 |
| Sales | 76,250 | 24,000 |
| Cost of Goods Sold | (45,750) | (14,400) |
| Gross Margin | $124,193 | $59,830 |
| Operating Expenses: | ||
| Advertising Expense | $7,500 | $5,000 |
| Bad Debt Expense | 330 | 0 |
| Depreciation Expense - Equipment | 13,000 | 5,667 |
| Depreciation Expense - Vehicles | 2,400 | 2,400 |
| Depreciation Expense - Building | 12,500 | 12,500 |
| Depreciation Expense - Land Improvements | 1,876 | 663 |
| Wages Expense | 22,870 | 10,500 |
| Total Expenses | 60,476 | 36,730 |
| Net Income | $63,717 | $23,100 |
