Pricing
Log in
Sign up
Home
Homework Help
Study Guides
Class Notes
Textbook Notes
Textbook Solutions
Booster Classes
Blog
Home
Textbook Notes
300,000
US
110,000
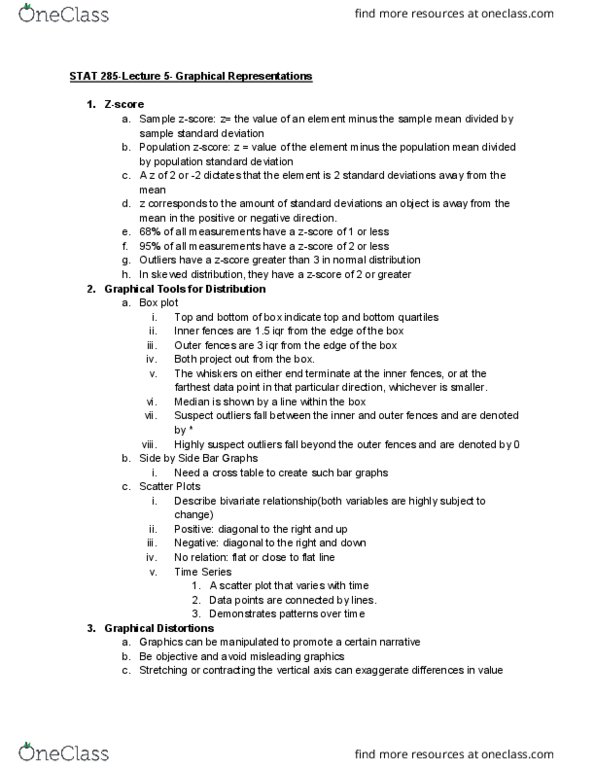
01:960:285 Chapter Notes - Chapter 2: Box Plot, Bar Chart, Interquartile Range
78
views
6
pages
lemoneel914
8 Jan 2019
School
Rutgers University
Department
Statistics and Biostatistic
Course
01:960:285
Professor
G. Popel
Like
For unlimited access to Textbook Notes, a
Class+
subscription is required.
azurewolf695
and
38026 others
unlocked
60
01:960:285 Full Course Notes
Verified Note
60 documents
Get access
Grade+
$40
USD/m
Billed monthly
Homework Help
Study Guides
Textbook Solutions
Class Notes
Textbook Notes
Booster Class
10 Verified Answers
Class+
$30
USD/m
Billed monthly
Homework Help
Study Guides
Textbook Solutions
Class Notes
Textbook Notes
Booster Class
7 Verified Answers
Continue
Related Documents
01:960:285 Lecture Notes - Lecture 5: Scatter Plot, Box Plot, Sample Size Determination
peardolphin530
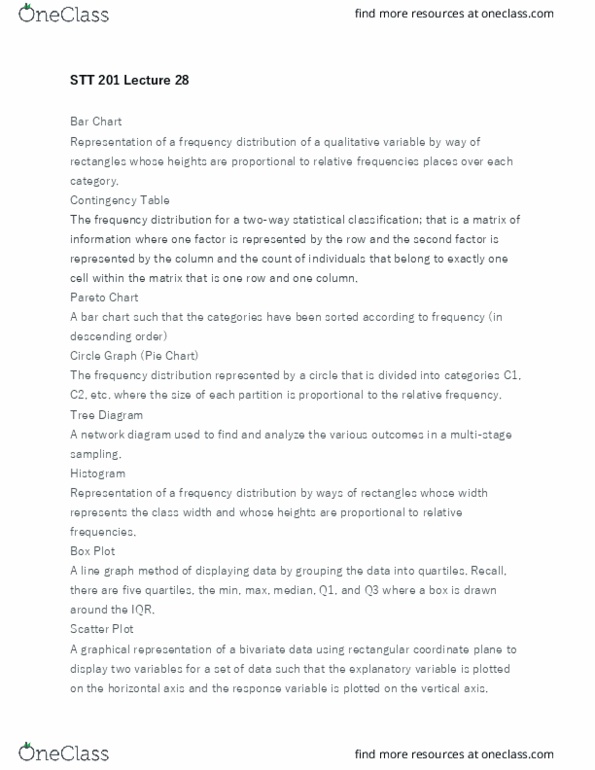
STT 201 Lecture Notes - Lecture 28: Bar Chart, Multistage Sampling, Dependent And Independent Variables
harlequinsalmon729
STA 2000
Final Exam
Study Guide
STA 2000 Study Guide - Final Guide: Simple Random Sample, Heteroscedasticity, Kurtosis
amethystbat202