PSYC1003 Lecture Notes - Lecture 8: Negative Relationship, Negative Number, Scatter Plot

Document Summary
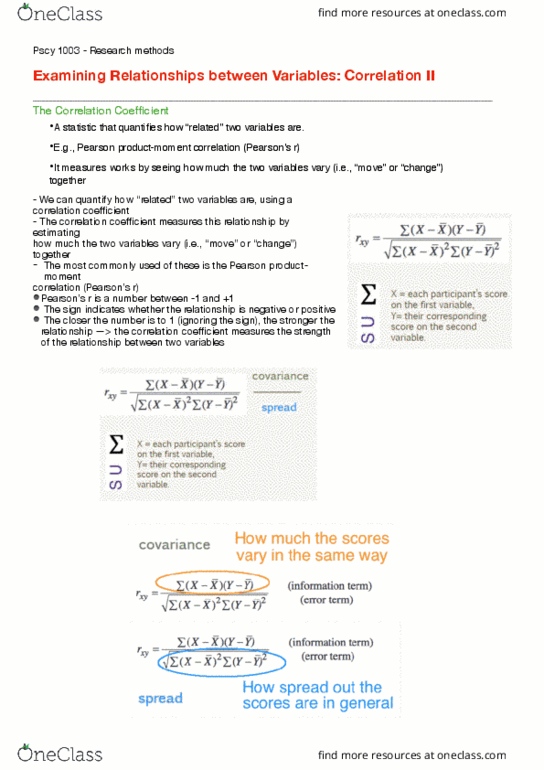
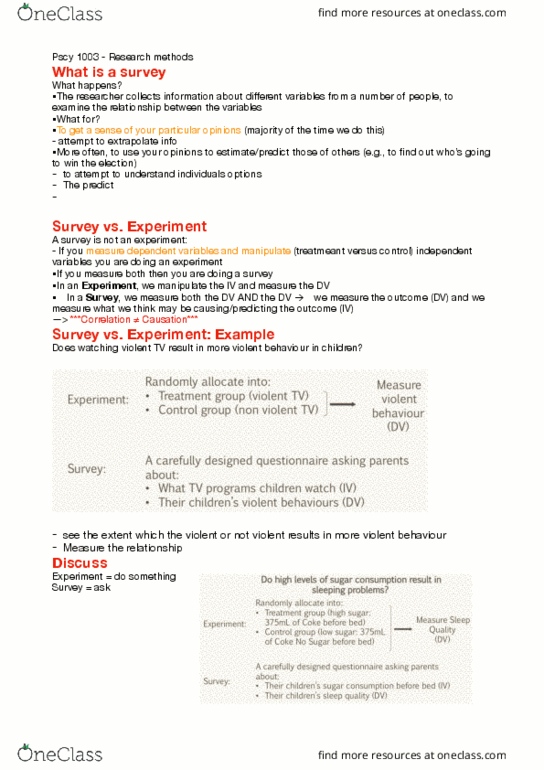
Correlation helps us to answer questions about whether there is a relationship between two variables: 1: both variables are continuous (i. e. , they can take any value) and/or one or both variables is ordinal. Often used when no causal relationship is hypothesised. Measure both variables: each participant"s reaction time, the amount of alcohol that each participant has consumed in the last hour, there is no obvious cause and effect . No relationship: whether one variables goes up or down, has no bearing on whether the other goes up or down no predictive utility of knowing either variable. The correlation coef cient measures this relationship by estimating how much the two variables vary (i. e. , move or change ) together: the most commonly used of these is the pearson product moment correlation (pearson"s r) Pearson"s r is a number between -1 and +1. The sign indicates whether the relationship is negative or positive.