MIS171 Lecture Notes - Lecture 10: Simple Linear Regression, Scatter Plot, Lincoln Near-Earth Asteroid Research

Document Summary
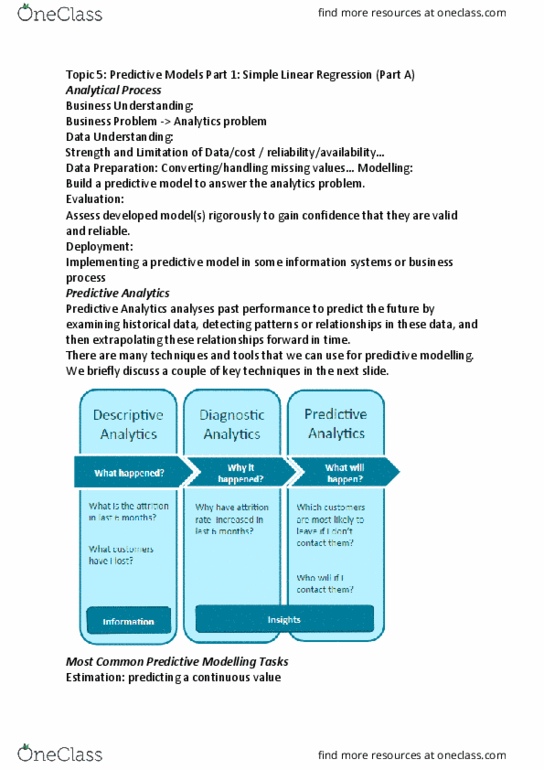
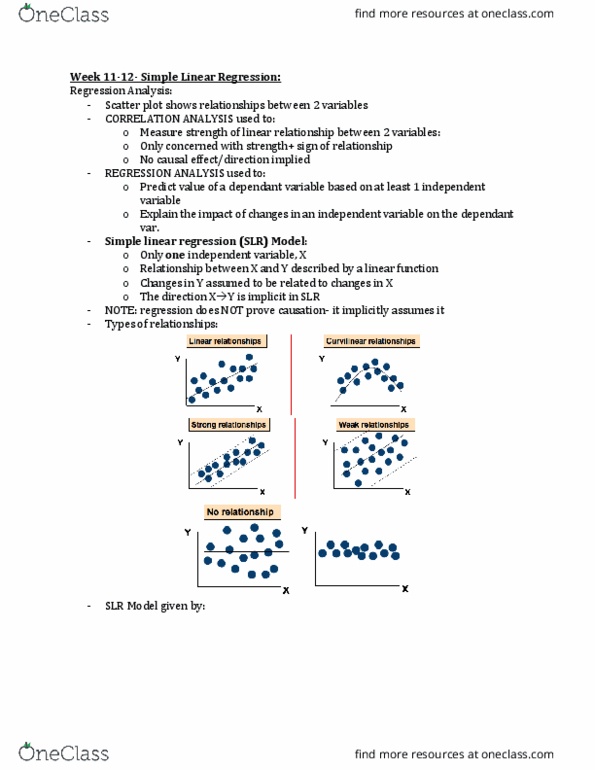
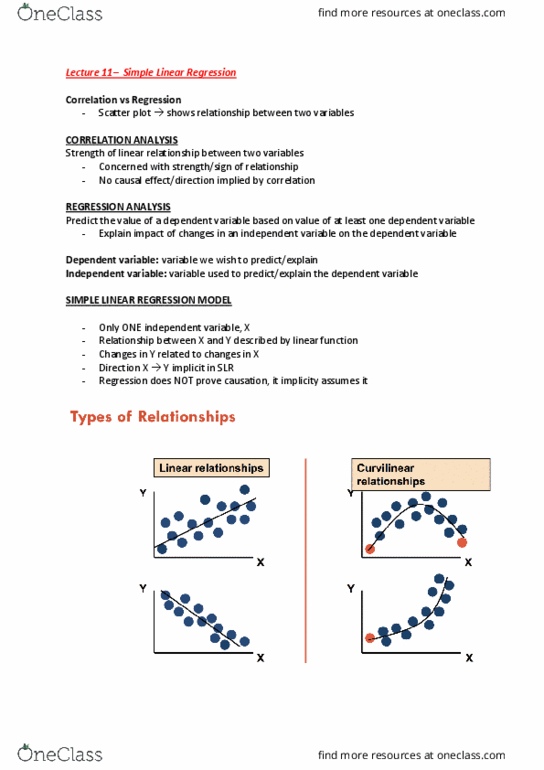
Explanation regression helps to understand the variation in dependant variable: do this by finding the independent variable, we wish to know the direction and strength of the relationship. Prediction: regression helps predict the likely outcome of the dependant variable. In situations where we have some control over the independent variable, we then in turn have some control over the dependant variable. Simple linear regression involves only one independent variable, meanwhile multiple regression involves the use of two or more independent variables to help explain the variation in the dependant variable. Plot pairs of variables on the scatter diagrams. The vertical (y) axis always has the dependant variable. The horizontal (x) axis always has the independent variable. We are looking for: no relationship, linear relationship, non-linear relationship. Is a relative measure of the strength of a linear relationship. The closer r is to +1 or -1 the stronger the linear relationship.