1305AFE Lecture Notes - Lecture 2: Time Series, Ogive, Frequency Distribution


Week 2 Business Data Analysis Lecture Notes
Graphical Descriptive Methods
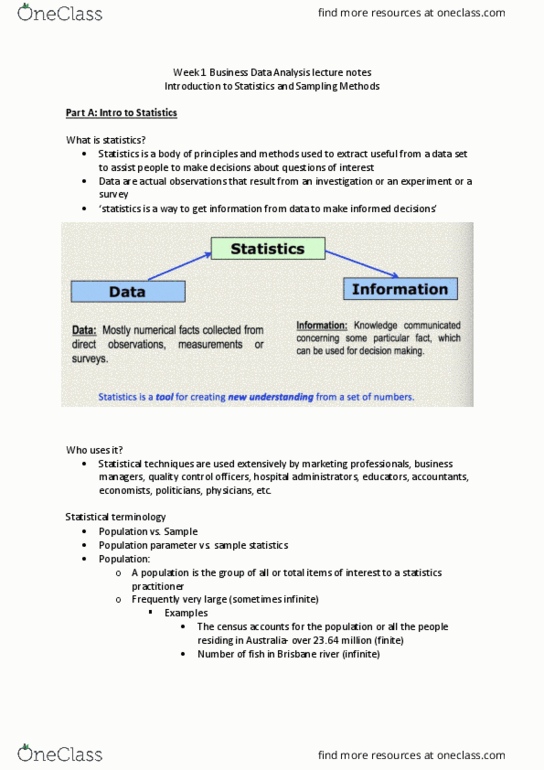
What is statistics?
• Statistics is a body of principles and methods used to extract useful information from
a data set to assist people to make decisions about questions of interest
• Data are actual observations that result from an investigation or an experiment or a
survey
Two Basic Areas of Statistics
• Descriptive statistics
o Deals with methods of organizing, summarizing and presenting data in a
convenient way
• Inferential statistics
o Is a body of methods for estimating and drawing conclusions about the
population characteristics (population parameters) from a sample taken from
the population.
Descriptive statistics
• Methods of organizing, summarizing, and presenting data in a convenient and
informative way. These methods include:
o Graphical techniques
o Numerical techniques
Summaries data
• Graphical descriptive methods
o Pie and bar charts
o Histograms
o Line chart
o Scatter diagrams
Bar Charts
• Good for qualitative/ nominal data
• Bar charts are most common as they are easier for human eye to distinguish
differences and make comparisons
o Commonly used to graphically represent the frequency of each category
find more resources at oneclass.com
find more resources at oneclass.com

• Pie charts are commonly used to graphically represent the proportion of each
category
find more resources at oneclass.com
find more resources at oneclass.com

find more resources at oneclass.com
find more resources at oneclass.com
Document Summary
Two basic areas of statistics: descriptive statistics, deals with methods of organizing, summarizing and presenting data in a convenient way. Is a body of methods for estimating and drawing conclusions about the population characteristics (population parameters) from a sample taken from the population. Descriptive statistics: methods of organizing, summarizing, and presenting data in a convenient and informative way. These methods include: graphical techniques, numerical techniques. Summaries data: graphical descriptive methods, pie and bar charts, histograms, line chart, scatter diagrams. Frequency polygon: the frequency polygon is obtained by joining the mid points of each class in the frequency histogram. Relative frequency polygon: the relative frequency polygon is obtained by joining the mid points of each class in the relative frequency histogram. Ogive: the ogive curve is obtained by joining the upper limits of each class of cumulative relative frequency histogram. Line chart: good for time series data- quantitative or numerical, show patterns over time.