ACCG100 Lecture Notes - Lecture 8: Current Liability, Financial Statement, Asset

11 May 2018
School
Department
Course
Professor

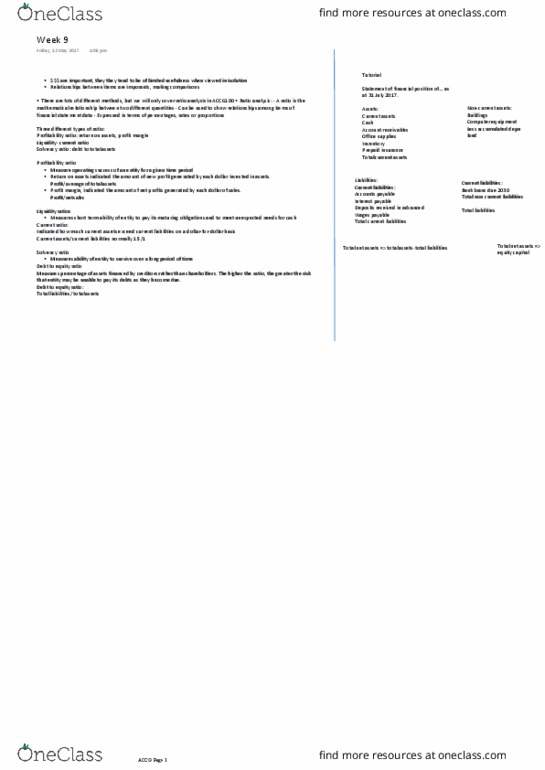
Financial Statements Continued
Fiaial stateets are iportat, ut to judge whether the usiess’ perforae was good, we
much make comparisons between entities (competitors) and within entities (past performance). So
we a’t look at fiaial questions in isolation.
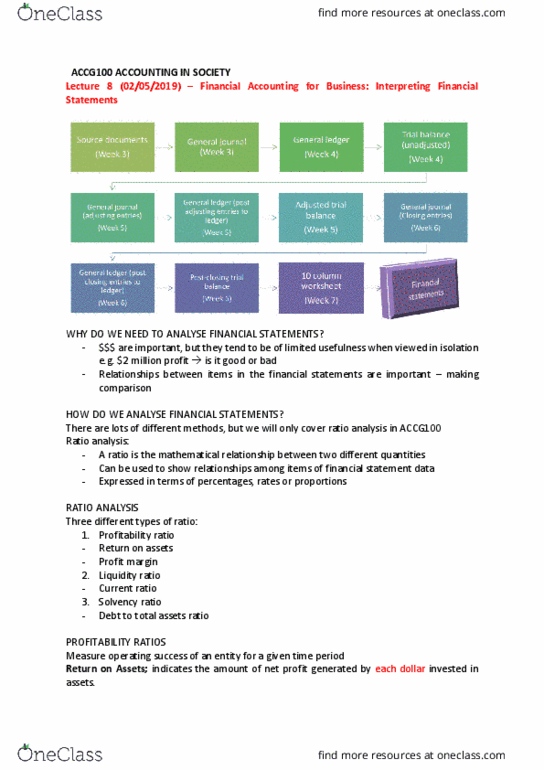
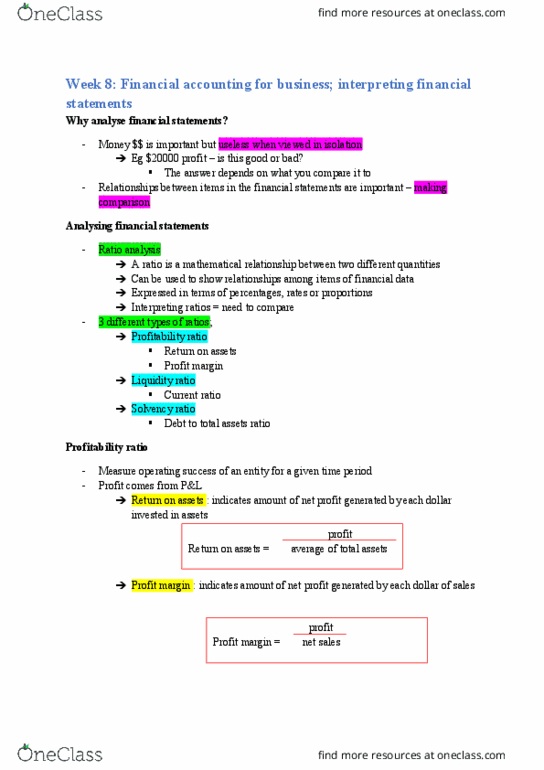
There are many ways to make these comparisons, but we will only cover ratio analysis in ACCG100,
which can be used to show relationships among items of financial statement data. There are three
different types of ratios:
Profitability ratio:
Measure operating success of an entity for a given time period.
Higher return on assets means that the business is more efficient at using its assets/resources to
generate profit.
Liquidity ratio
Measure short-term ability of entity to pay its maturing obligations and to meet unexpected needs
for cash. We refer to the balance sheet.
A higher current ratio means stronger liquidity.
Solvency ratio
Measures ability of entity to survive over a long period of time.
The higher the ratio, the greater risk that entity may be unable to pay its debts as they become due.
Glossary
• Current ratio: Indicates how much current assets exceed current liabilities on a dollar-for-
dollar basis (rule of thumb is normally 1.5:1).
• Debt to total assets ratio: Measures percentage of assets financed by creditors rather than
shareholders.
• Liquidity ratio: Measures short-term ability of entity to pay its maturing obligations and to
meet unexpected needs for cash. We use the current ratio: current assets / current
liabilities.
• Profitability ratio: Measures operating success of an entity for a given time period (usually a
financial year). The ratio that we use is the return on assets: profit / average total assets.
• Ratio: mathematical relationship between two different quantities. It is expressed in terms
of percentages, rates or proportions.
• Return on assets: Indicates amount of net profit generated by each dollar invested in assets.
find more resources at oneclass.com
find more resources at oneclass.com
Document Summary
Fi(cid:374)a(cid:374)(cid:272)ial state(cid:373)e(cid:374)ts are i(cid:373)porta(cid:374)t, (cid:271)ut to judge whether the (cid:271)usi(cid:374)ess" perfor(cid:373)a(cid:374)(cid:272)e was good, we much make comparisons between entities (competitors) and within entities (past performance). So we (cid:272)a(cid:374)"t look at fi(cid:374)a(cid:374)(cid:272)ial questions in isolation. There are many ways to make these comparisons, but we will only cover ratio analysis in accg100, which can be used to show relationships among items of financial statement data. Measure operating success of an entity for a given time period. Higher return on assets means that the business is more efficient at using its assets/resources to generate profit. Measure short-term ability of entity to pay its maturing obligations and to meet unexpected needs for cash. Measures ability of entity to survive over a long period of time. The higher the ratio, the greater risk that entity may be unable to pay its debts as they become due.