CHIN20005 Lecture 9: 听力答案文本 (Week 2)

Get access


Related Documents


Related Questions
The following table provides quarterly sales data of frozen pie by Edwardâs Pie Company for the period 2002-2013
| Unit Sales (Q) | Price ($) | Advertising Expenditures ($) | Competitors' Price ($) | Income ($) | Population | ||
| Period | Q | P | A | PX | M | Pop | |
| 1 | 2002 | 193,334 | 6.39 | 15,827 | 6.92 | 33,337 | 4,116,250 |
| 2 | 170,041 | 7.21 | 20,819 | 4.84 | 33,390 | 4,140,338 | |
| 3 | 247,709 | 5.75 | 14,062 | 5.28 | 33,599 | 4,218,965 | |
| 4 | 183,259 | 6.75 | 16,973 | 6.17 | 33,797 | 4,226,070 | |
| 5 | 2003 | 282,118 | 6.36 | 18,815 | 6.36 | 33,879 | 4,278,912 |
| 6 | 203,396 | 5.98 | 14,176 | 4.88 | 34,186 | 4,359,442 | |
| 7 | 167,447 | 6.64 | 17,030 | 5.22 | 35,691 | 4,363,494 | |
| 8 | 361,677 | 5.30 | 14,456 | 5.80 | 35,950 | 4,380,084 | |
| 9 | 2004 | 401,805 | 6.08 | 27,183 | 4.99 | 34,983 | 9,184,926 |
| 10 | 412,312 | 6.13 | 27,572 | 6.13 | 35,804 | 9,237,683 | |
| 11 | 321,972 | 7.24 | 34,367 | 5.82 | 35,898 | 9,254,182 | |
| 12 | 445,236 | 6.08 | 26,895 | 6.05 | 36,113 | 9,272,758 | |
| 13 | 2005 | 479,713 | 6.40 | 30,539 | 5.37 | 36,252 | 9,300,401 |
| 14 | 459,379 | 6.00 | 26,679 | 4.86 | 36,449 | 9,322,168 | |
| 15 | 444,040 | 5.96 | 26,607 | 5.29 | 37,327 | 9,323,331 | |
| 16 | 376,046 | 7.21 | 32,760 | 4.89 | 37,841 | 9,348,725 | |
| 17 | 2006 | 255,203 | 6.55 | 19,880 | 6.97 | 34,870 | 5,294,645 |
| 18 | 270,881 | 6.11 | 19,151 | 6.25 | 35,464 | 5,335,816 | |
| 19 | 330,271 | 5.62 | 15,743 | 6.03 | 35,972 | 5,386,134 | |
| 20 | 313,485 | 6.06 | 17,512 | 5.08 | 36,843 | 5,409,350 | |
| 21 | 2007 | 311,500 | 5.83 | 16,984 | 5.29 | 37,573 | 5,409,358 |
| 22 | 370,780 | 5.38 | 15,698 | 6.19 | 37,781 | 5,425,001 | |
| 23 | 152,338 | 7.41 | 22,057 | 6.94 | 37,854 | 5,429,300 | |
| 24 | 320,804 | 6.19 | 17,460 | 6.38 | 39,231 | 5,442,595 | |
| 25 | 2008 | 738,760 | 5.75 | 42,925 | 5.54 | 28,579 | 16,381,600 |
| 26 | 707,015 | 6.61 | 50,299 | 6.73 | 28,593 | 16,544,289 | |
| 27 | 699,051 | 5.03 | 37,364 | 5.04 | 28,633 | 16,547,258 | |
| 28 | 628,838 | 6.76 | 50,602 | 4.61 | 28,833 | 16,553,958 | |
| 29 | 2009 | 631,934 | 7.04 | 53,562 | 5.85 | 29,242 | 16,587,432 |
| 30 | 651,162 | 6.70 | 48,911 | 5.63 | 29,876 | 16,680,782 | |
| 31 | 765,124 | 6.54 | 49,422 | 6.94 | 30,327 | 16,716,936 | |
| 32 | 741,364 | 5.73 | 44,061 | 6.37 | 30,411 | 16,717,938 | |
| 33 | 2010 | 291,773 | 5.35 | 13,896 | 5.78 | 29,778 | 2,972,443 |
| 34 | 153,018 | 6.33 | 27,429 | 4.73 | 30,079 | 2,974,275 | |
| 35 | 574,486 | 5.94 | 31,631 | 6.70 | 30,598 | 2,989,720 | |
| 36 | 75,396 | 7.00 | 39,176 | 4.58 | 30,718 | 3,020,244 | |
| 37 | 2011 | 590,190 | 5.19 | 33,538 | 5.17 | 30,922 | 3,021,618 |
| 38 | 288,112 | 7.02 | 53,643 | 5.15 | 31,199 | 3,025,298 | |
| 39 | 276,619 | 7.02 | 60,284 | 5.46 | 31,354 | 3,042,834 | |
| 40 | 522,446 | 5.23 | 53,595 | 6.06 | 31,422 | 3,063,011 | |
| 41 | 2012 | 395,314 | 5.80 | 22,626 | 6.56 | 38,892 | 7,611,304 |
| 42 | 436,103 | 5.32 | 22,697 | 6.38 | 39,080 | 7,615,783 | |
| 43 | 336,338 | 6.35 | 25,475 | 4.53 | 39,510 | 7,666,220 | |
| 44 | 451,321 | 5.95 | 25,734 | 6.31 | 39,552 | 7,710,368 | |
| 45 | 2013 | 352,181 | 6.01 | 23,777 | 6.24 | 39,776 | 7,713,007 |
| 46 | 317,322 | 7.02 | 27,544 | 4.86 | 41,068 | 7,752,393 | |
| 47 | 422,455 | 5.71 | 23,852 | 4.86 | 41,471 | 7,754,204 | |
| 48 | 290,963 | 7.36 | 30,487 | 5.32 | 41,989 | 7,782,654 |
Where Q = the quantity of pies sold during a quarter, P = retail price in dollars, A = advertising expenditure in dollars, Px = price charged by a competing pie company in dollars, M = disposable income per capita in the area, in dollars, Pop = population of the market area.
Estimate the model Q = a0 + a1 P + a2 A + a3 Px + a4 M + a5 Pop relating quantity sold as a function of price charged by Edwardâs Pie, advertising, price charged by the competitors, and area population. Write the estimated model in equation form.
Carefully interpret the estimated coefficients in the model
Are the estimated coefficients statistically significant? Use the reported p values to carry out the tests.
Discuss the explanatory power of the model. What percentage of variations in sales is explained by the estimated regression equation?
Use the estimated regression model to forecast sales for the first quarter of 2014, for following values of the independent variables:
P = $8.50, A = $40,000, Px = 7.50, M = $43,000, and Pop = 8,500,000

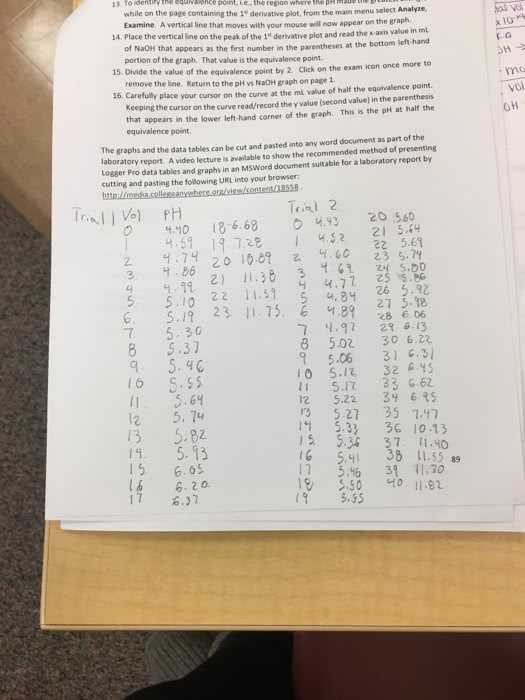
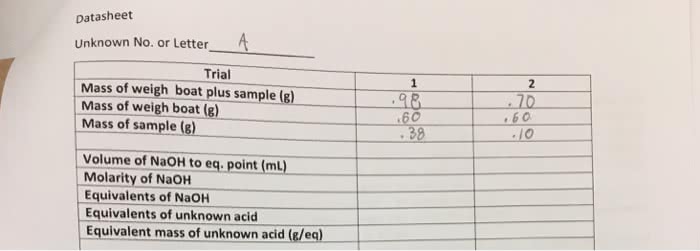
Please find 75% equivalence point, 25% equivalence point, difference in equivalence points, and molecular weight? and based on the results, determine the unknown acid (possibilities: acetic acid, oxalic acid, benzoic acid, maleic acid, malic acid, and KHP).
I did pH vs. NaOH titration curve graph and found the end point as 38.20. The standrdized NaOH(M) was 0.084±0.002 and used unknown acid was 0.6505g.
Below is a data of pH vs. NaOH titration:
| V(NaOH), mL | pH |
| 0 | 3.8 |
| 2 | 3.92 |
| 2.5 | 3.92 |
| 3 | 4.02 |
| 3.5 | 4.06 |
| 4 | 4.08 |
| 4.5 | 4.13 |
| 5 | 4.15 |
| 5.5 | 4.18 |
| 6 | 4.22 |
| 6.5 | 4.26 |
| 7 | 4.29 |
| 7.5 | 4.31 |
| 8 | 4.34 |
| 8.5 | 4.37 |
| 9 | 4.41 |
| 9.5 | 4.44 |
| 10 | 4.45 |
| 10.5 | 4.45 |
| 11 | 4.53 |
| 11.5 | 4.55 |
| 12 | 4.57 |
| 12.5 | 4.61 |
| 13 | 4.62 |
| 13.5 | 4.65 |
| 14 | 4.67 |
| 14.5 | 4.68 |
| 15 | 4.71 |
| 15.5 | 4.75 |
| 16 | 4.77 |
| 16.5 | 4.8 |
| 17 | 4.83 |
| 17.5 | 4.83 |
| 18 | 4.85 |
| 18.5 | 4.9 |
| 19 | 4.9 |
| 19.5 | 4.92 |
| 20 | 4.95 |
| 20.5 | 4.98 |
| 21 | 5.01 |
| 21.5 | 5.04 |
| 22 | 5.04 |
| 22.5 | 5.05 |
| 23 | 5.07 |
| 23.5 | 5.09 |
| 24 | 5.11 |
| 24.5 | 5.14 |
| 25 | 5.17 |
| 25.5 | 5.19 |
| 26 | 5.22 |
| 26.5 | 5.26 |
| 27 | 5.3 |
| 27.5 | 5.31 |
| 28 | 5.33 |
| 28.5 | 5.36 |
| 29 | 5.39 |
| 29.2 | 5.42 |
| 29.4 | 5.43 |
| 29.6 | 5.44 |
| 29.8 | 5.45 |
| 30 | 5.45 |
| 30.2 | 5.48 |
| 30.4 | 5.5 |
| 30.6 | 5.51 |
| 30.8 | 5.52 |
| 31 | 5.54 |
| 31.2 | 5.56 |
| 31.4 | 5.59 |
| 31.6 | 5.61 |
| 31.8 | 5.62 |
| 32 | 5.64 |
| 32.2 | 5.66 |
| 32.4 | 5.68 |
| 32.6 | 5.71 |
| 32.8 | 5.73 |
| 33 | 5.85 |
| 33.2 | 5.77 |
| 33.4 | 5.79 |
| 33.6 | 5.8 |
| 33.8 | 5.82 |
| 34 | 5.83 |
| 34.2 | 5.85 |
| 34.4 | 5.88 |
| 34.6 | 5.89 |
| 34.8 | 5.93 |
| 35 | 5.96 |
| 35.2 | 5.98 |
| 35.4 | 6.02 |
| 35.6 | 6.05 |
| 35.8 | 6.08 |
| 36 | 6.13 |
| 36.2 | 6.19 |
| 36.4 | 6.24 |
| 36.6 | 6.26 |
| 36.8 | 6.32 |
| 37 | 6.37 |
| 37.2 | 6.44 |
| 37.3 | 6.53 |
| 37.4 | 6.64 |
| 37.5 | 6.68 |
| 37.6 | 6.76 |
| 37.7 | 6.68 |
| 37.8 | 7.07 |
| 37.9 | 7.23 |
| 38 | 7.57 |
| 38.05 | 8.07 |
| 38.1 | 8.14 |
| 38.15 | 8.42 |
| 38.2 | 8.7 |
| 38.25 | 8.92 |
| 38.3 | 9.16 |
| 38.35 | 9.38 |
| 38.4 | 9.51 |
| 38.45 | 9.64 |
| 38.5 | 9.74 |
| 38.55 | 9.85 |
| 38.6 | 9.93 |
| 38.65 | 9.97 |
| 38.7 | 10 |
| 38.8 | 10.27 |
| 39 | 10.32 |
| 39.2 | 10.36 |
| 39.4 | 10.45 |
| 39.6 | 10.56 |
| 39.8 | 10.68 |
| 40 | 10.78 |
| 40.5 | 10.92 |
| 41 | 11.06 |
| 41.5 | 11.18 |
| 42 | 11.24 |
| 42.5 | 11.32 |
| 43 | 11.37 |
| 43.5 | 11.4 |
| 44 | 11.47 |
| 44.5 | 11.52 |
| 45 | 11.57 |
| 45.5 | 11.61 |