PSYC20006 Lecture Notes - Lecture 5: Central Limit Theorem, Standard Deviation, Null Hypothesis

10 May 2018
School
Department
Course
Professor

Lecture 5
- Within group = repeated measures, same participants take part in each condition of
the independent variable
- Between group = independent measures, two or more separate groups, each
containing different individuals, where each participant only takes part in each
condition once
-
-
- Central limit theorem: most data are likely to be described by normal distribution
find more resources at oneclass.com
find more resources at oneclass.com

-
- Mean: average height of everyone in the town
- Variance: the sum of squares divided by degrees of freedom
- Sum of squares: for every individual measurement subtract the mean and square it,
square of the difference between each individual measurement and mean and sum it
all together
- Degrees of freedom: number of elements in sample - 1, number of individuals in town
- 1
- Population distribution: distribution of individuals
-
- Normal distribution
- Standard deviation is the square root of variance
- Mean and standard deviation allows us to describe the population distribution
(assume is normally distributed)
- Centered on mean
- Most of individuals have heights within 2 standard deviations of this mean
- By knowing the mean and standard deviation, able to describe the distribution of
heights of individuals
find more resources at oneclass.com
find more resources at oneclass.com

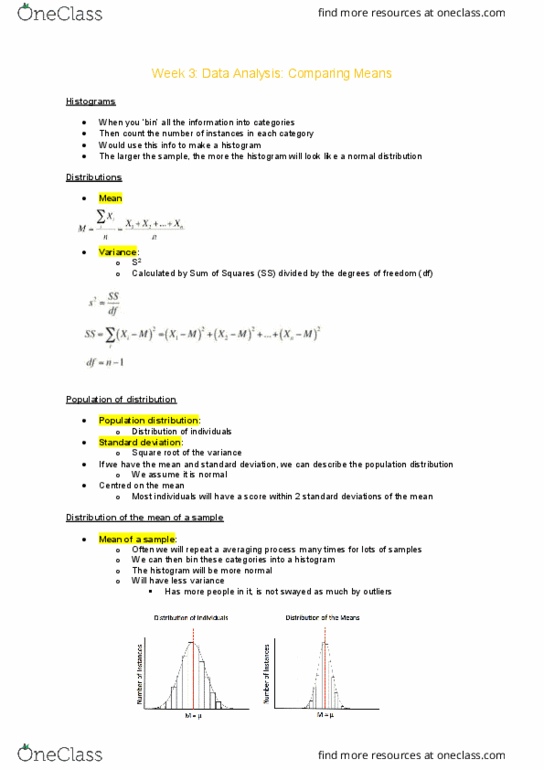
- Suppose we were to select 20 individuals, measure their average height, and repeat
this process 10,000 times
- We would then have 10,000 measurements, where each measurement is the
average height of 20 individuals, 10,000 averages
- Suppose we were to “bin” each of these measurement into categories (e.g. 180 cm,
181 cm etc) and record the number of instances in each category
- We would expect the resulting histogram to be normally distributed, centered on the
population mean but, crucially, have less variance than the population distribution
-
- When you measure individuals occasionally come across someone who is
extraordinary → they end up on tails of distribution
- If measure 20 people, one person is very tall but most people won’t be very tall,
maybe some shorter than average → his tallness doesn’t affect population average
very much because have 19 other people in sample (some slightly taller some
slightly shorter than average)
- Average of distribution will tend to have less variance
- Distribution of means will have less variance/less spread out than the distribution of
individuals
- If sample 20 people and measure their average height, sample another 20 people
and measure their average height → those 2 numbers will probably be quite similar
- More people in sample → more similar the averages
- Measure average height of 1,000 people and measure average height of another
1,000 people → those 2 averages will be very similar because sample sizes are
larger, measurements are more reliable
-
find more resources at oneclass.com
find more resources at oneclass.com
Document Summary
Within group = repeated measures, same participants take part in each condition of the independent variable. Between group = independent measures, two or more separate groups, each containing different individuals, where each participant only takes part in each condition once. Central limit theorem: most data are likely to be described by normal distribution. Mean: average height of everyone in the town. Variance: the sum of squares divided by degrees of freedom. Sum of squares: for every individual measurement subtract the mean and square it, square of the difference between each individual measurement and mean and sum it all together. Degrees of freedom: number of elements in sample - 1, number of individuals in town. Standard deviation is the square root of variance. Mean and standard deviation allows us to describe the population distribution (assume is normally distributed) Most of individuals have heights within 2 standard deviations of this mean.