PSYC20006 Lecture Notes - Lecture 3: Null Hypothesis, Statistical Hypothesis Testing, Repeated Measures Design

1 Jul 2018
School
Department
Course
Professor
PSYC20006 Biological Psychology
1
WEEKS 1 - 5: STATISTICS & IMAGING METHODS
LECTURE 3 – 4 (W2): Statistical Hypothesis Testing
Statistical Hypothesis Testing
• Use it because of limitations, e.g: small sample size; group not representative of
population; measurement error; random factors; luck/chance
• Need to compare results to probability distribution representing chance:
o How likely that result found by chance or if it’s a real difference
o Some extreme outcomes highly unlikely
o It’s just SD
• Construct theoretical test distribution for hypothesis that everything is due to
chance
o Find how unlikely empirical result because of chance distribution (H0
distribution) - reject if highly unlikely
o Distribution looks different depending on degrees of freedom (
df
)
▪
df
= # free variables given we know that the average = 0
▪
df
larger with more people tested, better estimate
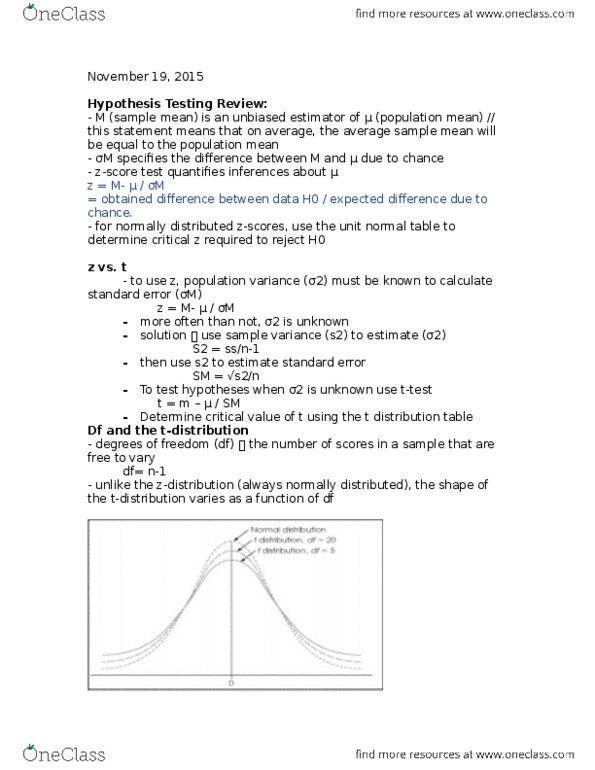
Test Distribution:
t
-distribution
• Contains: expected mean; standard error of the mean (SM)
• Don't know population
SD
(or variance)
•
t
-value distribution varies with
df
o broader if lower; normal if larger
•
df
calculated from sample size (
n
)
Experimental designs
• Between-groups designs (independent-measures design)
o 2 groups, values come from different people
o Advantages
▪ Measurements are truly independent
▪ No concern about learning effects from repeated exposure
o Disadvantages
▪ People in different groups might be different in various ways: IQ,
motivation etc. → need large sample size or counterbalance factors
that might influence results
▪ Can’t study behaviour over time
• Within group designs (repeated-measures design)
o 1 group, values for both experimental conditions from same people
o Advantage
▪ No differences in baseline, personality, IQ, motivation etc.
▪ Can study changes in behaviour over time
▪ Usually can test less people
Document Summary
Weeks 1 - 5: statistics & imaging methods. Lecture 3 4 (w2): statistical hypothesis testing. Test distribution: t-distribution: contains : expected mean ; standard error of the mean (sm, don"t know population sd (or variance, t-value distribution varies with df, broader if lower ; normal if larger, df calculated from sample size (n) Biological psychology: disadvantages, measurements not independent need to calculate variance differently, people know treatment after 1st condition, can"t be na ve in second round must counterbalance order of conditions to avoid unwanted order effects. Biological psychology: estimate percentage of variation explained by the. Treatment": guidelines, r2 = 0. 01: small effect, r2 = 0. 09: medium effect, r2 = 0. 25: large effect, confidence intervals (ci, a range of values fairly sure the true value lies in. Assumptions: observations must be independent, samples must be drawn from normal populations, samples must have equal variances if comparing 2 populations.